
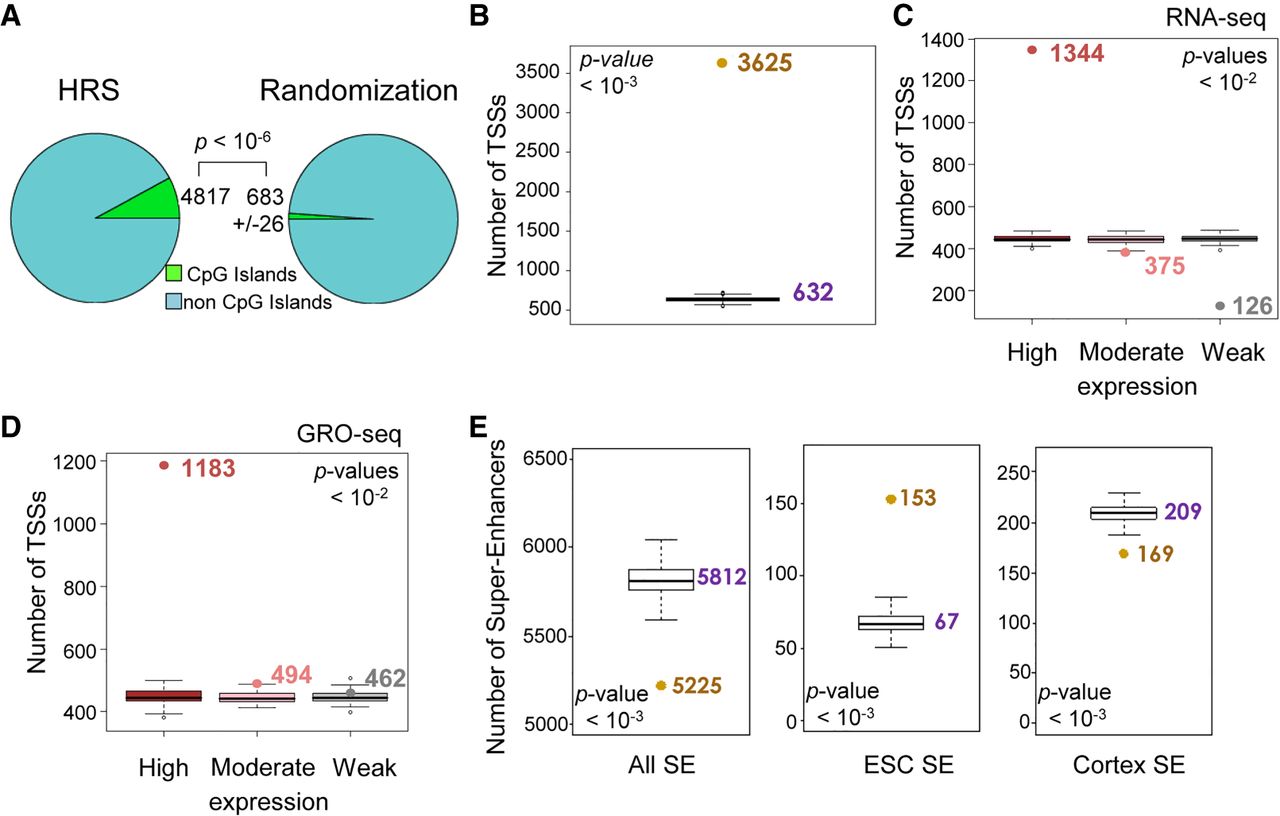
HRSs are associated with active genes and super-enhancers. (A) The number of HRSs that overlap with CpG islands (UCSC, mm9 build) was counted (4817; left) and compared to the mean counts (623 ± 26, SD) obtained from “random permutation tests” with n = 1000 random resampling (1000 sets of equivalent number of random StyI fragments; right). The P-value indicates the significance of the difference between the counts obtained for HRSs versus 1000 randomizations. (B) The number of TSSs that map into the ESC HRS set was counted (brown dot). This number was compared to the counts obtained from “random permutation tests” with n = 1000 random resampling (1000 sets of 61,080 random StyI fragments; box plots, median value obtained from randomizations is indicated in purple). The P-value indicates the significance of the difference between the counts obtained for HRSs versus 1000 randomizations. (C) Based on RNA-seq data available from ESCs (Wamstad et al. 2012), mouse genes were classified into three sets. The first set corresponds to the 3000 genes having the highest expression levels, the second to 3000 moderately expressed genes, and the last to the 3000 genes with the weakest expression levels (mean of two replicates). For each set, the number of HRS-associated genes were counted and compared with the counts obtained for equivalent numbers of genes taken at random. The P-value indicates the significance of the difference between the counts obtained for HRSs versus 100 randomizations (box plots). It is valid independently for the differences observed in the highly and weakly expressed gene sets. (D) Identical analysis as described above in C was performed using ESC GRO-seq data (Min et al. 2011). (E) The numbers of super-enhancers (Khan and Zhang 2016) that overlap with the ESC HRSs (brown dots) were counted for all super-enhancers known in the mouse genome (left) and for those that are active in ESCs (middle) or in the cortex (right). These numbers were compared to “random permutation tests” (1000 random sets of 61,080 StyI fragments; box plots, median value indicated in purple). The P-value indicates the significance of the difference between the counts obtained for HRSs versus 1000 randomizations.


