
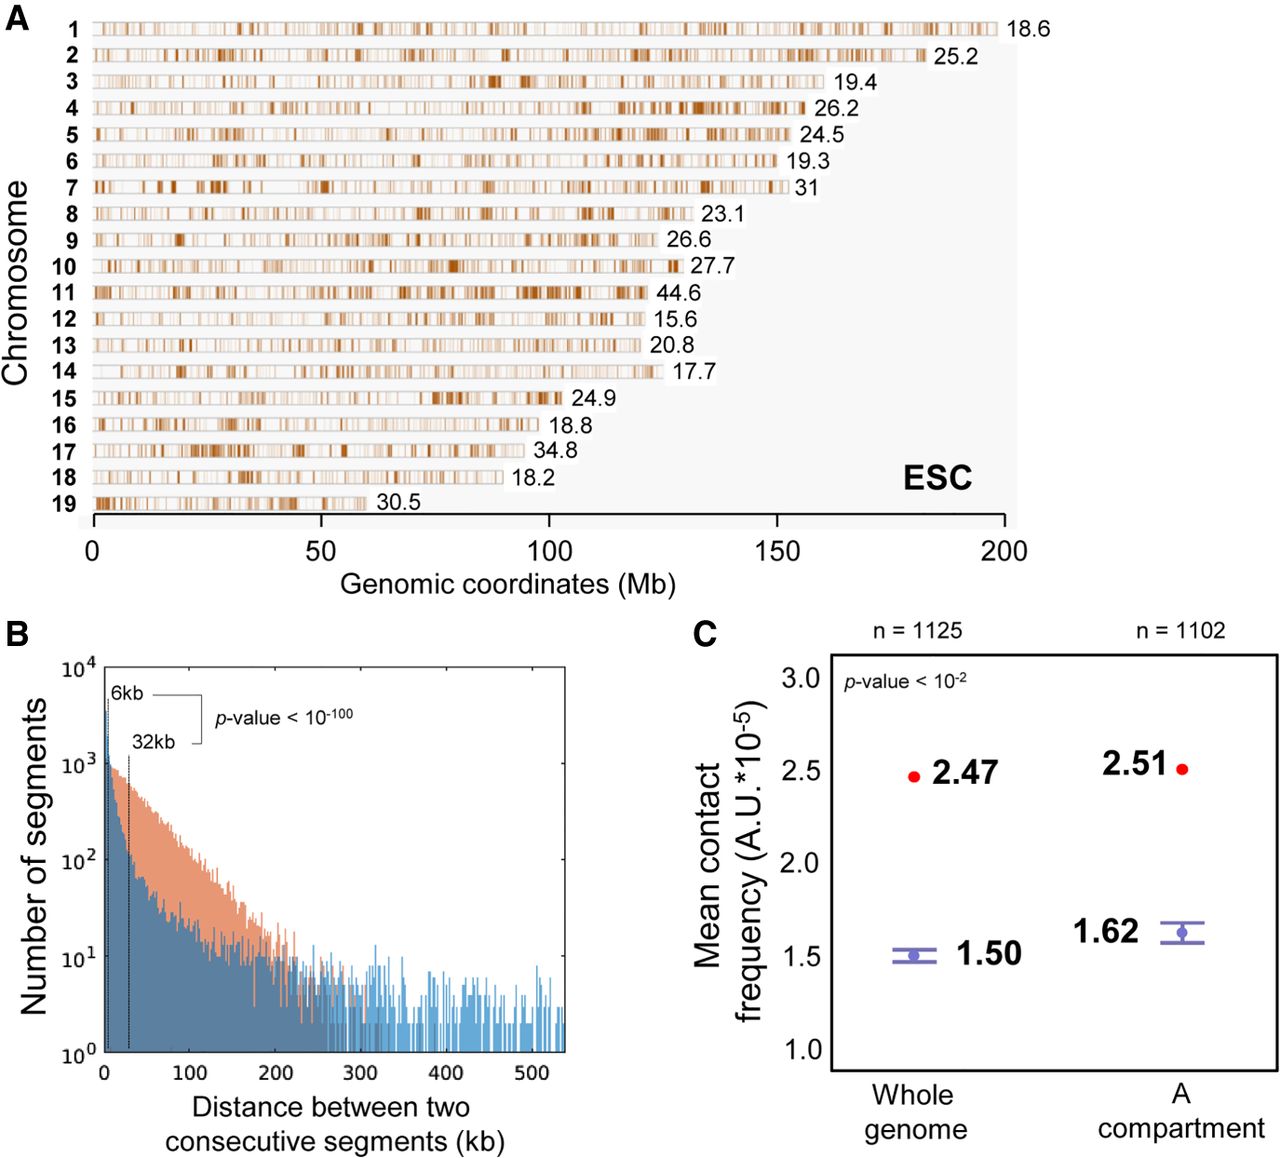
Chromosomal mapping of HRSs identified in mouse ESCs. (A) HRSs identified by HRS-seq performed in mouse ESCs have been mapped (brown bars) to mouse chromosomes. The mean densities of HRSs on each chromosome (HRS/Mb) are indicated on the figure. (B) The distance between consecutive HRSs (d) was determined. The graph shows the genome-wide distribution (1-kb bins) of non-null values for d corresponding to HRS (blue) and random (brown) StyI fragments. The median values of d for each distribution are indicated on the figure. The difference between the two distributions is highly significant, featuring a P-value lower than 10−100 (Wilcoxon rank-sum test). (C) The mean inter-chromosomal contact scores of 100-kb bins enriched in HRSs (red dots) were calculated from Hi-C data available for the same cell type (ESC) (Dixon et al. 2012) and compared to the mean contact scores obtained from 100 random sets of the same number of 100-kb bins (box plots). The box plot on the right represents the mean contact score and randomizations obtained when HRSs and random StyI fragments are taken only in the A compartment, while the box plot on the left represents the mean contact score and randomizations obtained from the whole genome. Bars, minimum and maximum values obtained in the 100 randomizations. The number of 100-kb bins (n) used for each randomizations is indicated on the figure. The P-value indicates the significance of the difference between the mean contact scores obtained for HRSs versus randomizations.


