
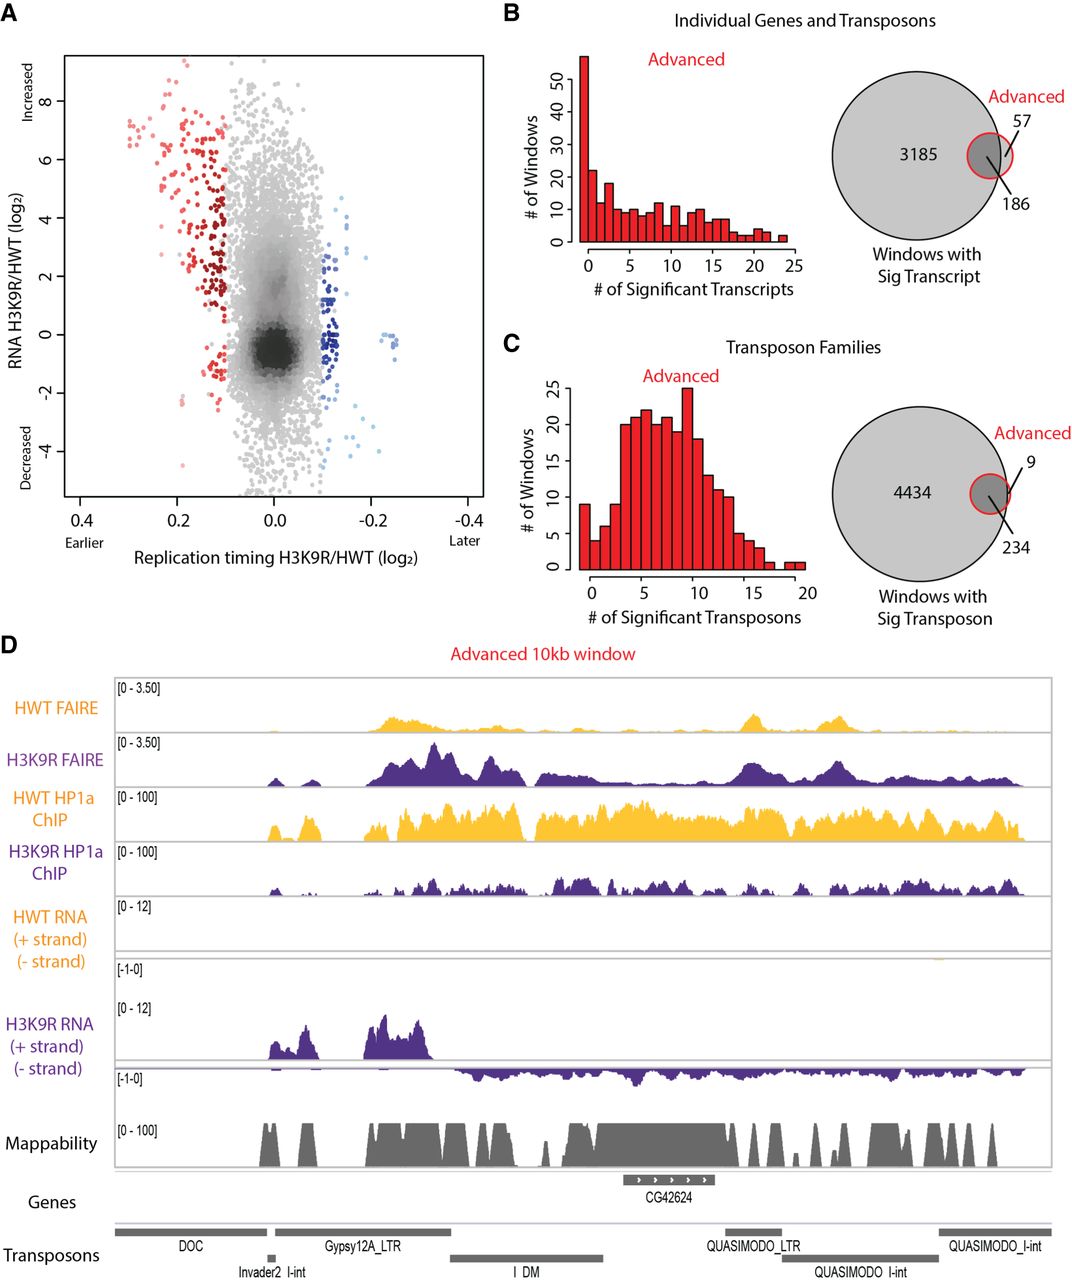
Altered transposon expression occurs at advanced replication domains in H3K9R mutants. (A) Heatscatter plot of the H3K9R/HWT ratio of RT values (log2 S/G1) plotted versus the H3K9R/HWT ratio of RNA-seq signal at all 10-kb windows across major chromosome scaffolds. RNA-seq differences were determined based on the transcript with the lowest P-value across the 10-kb window; 10-kb windows with significantly advanced (red) and delayed (blue) RT are indicated (P < 0.05, log2 fold change > 0.1; limma). (B) Histogram of the number of differentially expressed transcripts in 10-kb windows of advanced replication (red; left). Venn diagram comparing the number of windows with differentially expressed transcripts and number of windows with advanced replication (right). (C) Histogram of the number of transposons belonging to a differentially expressed transposon family in 10-kb windows of advanced replication (red; left). Venn diagram comparing the number of windows with a transposon belonging to a differentially expressed transposon family to the number of windows with advanced replication (right). (D) Browser shot of a 10-kb window (Chr 3R: 2,130,000–2,140,000) with advanced replication. HWT (yellow) and H3K9R (purple) FAIRE-seq, HP1a ChIP-seq, and RNA-seq data plotted in the context of mappability, genes, and transposons.


