
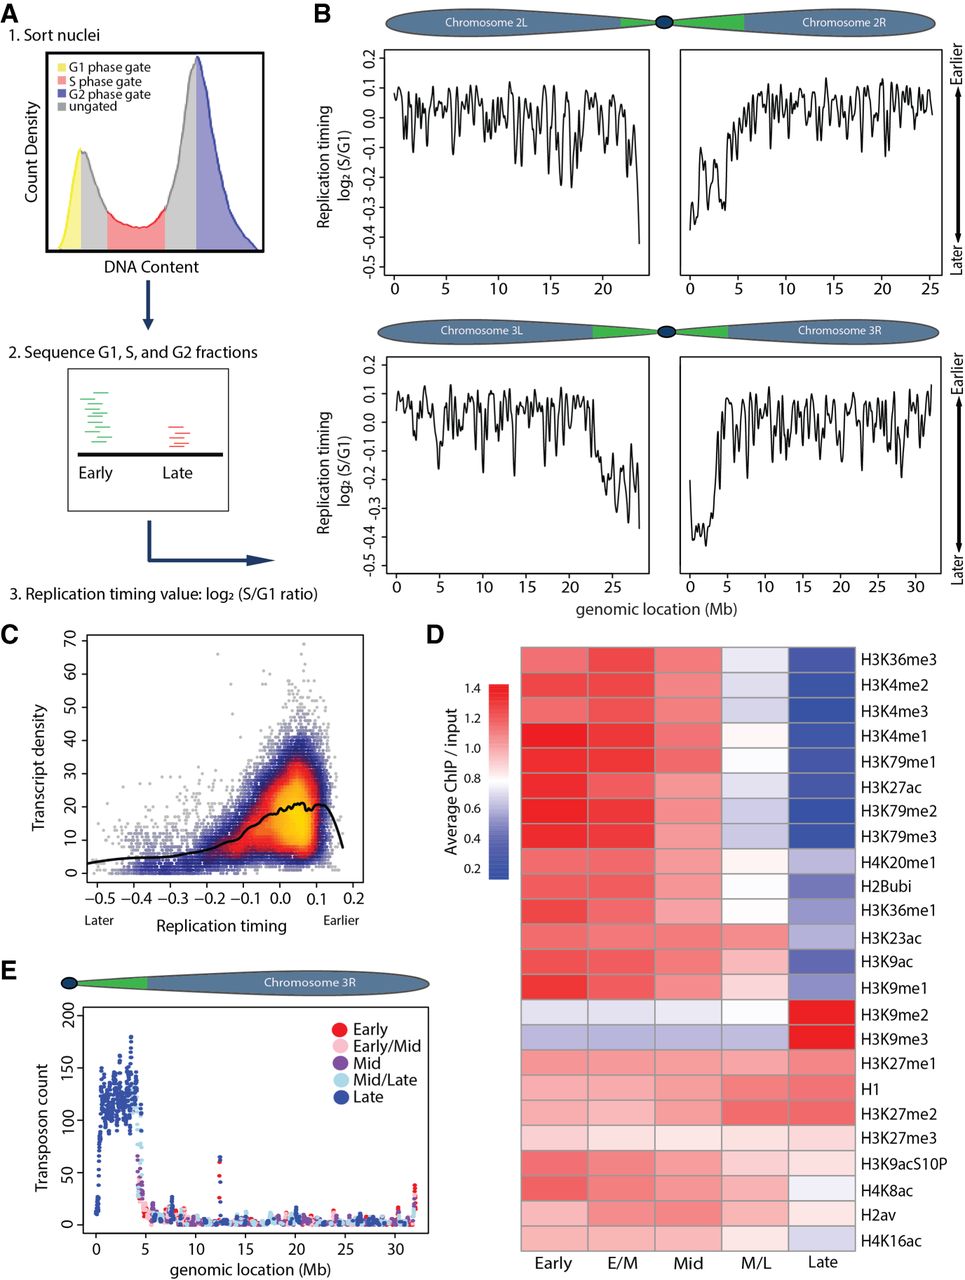
Measuring genome-wide replication timing in vivo. (A) Experimental paradigm: (1) Nuclei were FACS sorted into G1 (yellow), S (red), and G2 (blue) populations based on DNA content. (2) Sequenced DNA was mapped to the dm6 genome. More reads map to early than late replicating sequences. (3) Log2 S/G1 ratio generates RT profiles. Normalizing to G1 or G2 phase controls gave similar results. (B) LOESS regression line showing average yw (“yellow, white” control genetic background used for all fly lines) RT values (log2 S/G1) in 100-kb windows with 10-kb slide across Chr 2 and 3. Chromosome schematics show approximate locations of constitutive pericentric heterochromatin (green) and largely euchromatic arms (blue) (Riddle et al. 2011; Hoskins et al. 2015). (C) Heatscatter plot of yw log2 S/G1 (RT) versus gene density at all 10-kb windows across the genome with LOESS regression line (black). (D) Heat map of relative modENCODE histone PTM enrichment in bins of equally sized RT quintiles (early, early/mid, mid, mid/late, and late) generated using RT values (log2 S/G1) within 100-kb windows. modENCODE data are from third instar larvae (Celniker et al. 2009; see Supplemental Materials for accession numbers). Color indicates average enrichment of all windows within a quintile. Scale of heat map was capped at 1.4 to better represent distribution of values, as H3K9me2/me3 was greatly enriched in late replicating domains compared to other PTMs (see Supplemental Fig. S2E for noncapped H3K9me2/me3 heat map). (E) Plot of transposon number in 100-kb windows across Chr 3R with RT quintile (as determined in D) indicated by color.


