
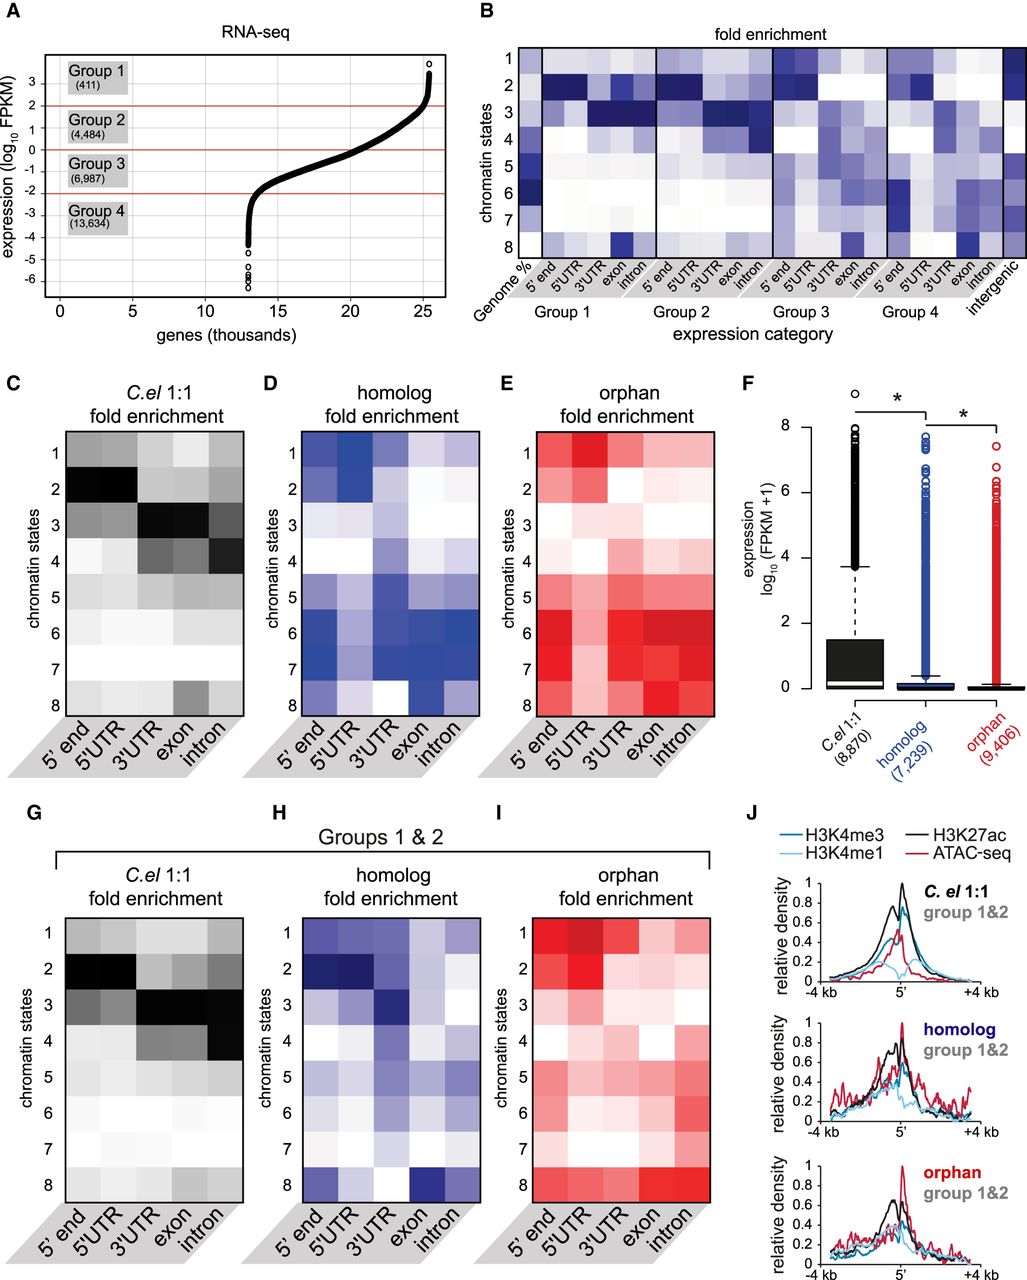
Chromatin states correlate with expression, but expressed young genes exhibit distinct profiles. (A) Average expression (FPKM) from two biological replicates of RNA-seq, plotted for each gene from highest to lowest along the x-axis. Expression categories were binned according to approximate inflection points. (B) Chromatin state enrichment of each expression category broken down by genetic element (i.e., TSSs, UTRs, exons, and introns). (C–E) Similar to B, but for each evolutionary gene class. (F) Expression of each evolutionary gene class determined from average RNA-seq FPKMs: (*) P-value <0.05, Welch's t-test (two-tailed). (G–I) Similar to B–E, but only for highly expressed (groups 1 and 2) genes belonging to each category. (J) Normalized average densities of H3K4me3, H3K4me1, H3K27ac, and ATAC-seq over a 7-kb window centered at 5′ ends. Densities were measured in HOMER and normalized to the highest and lowest values in each gene class.


