
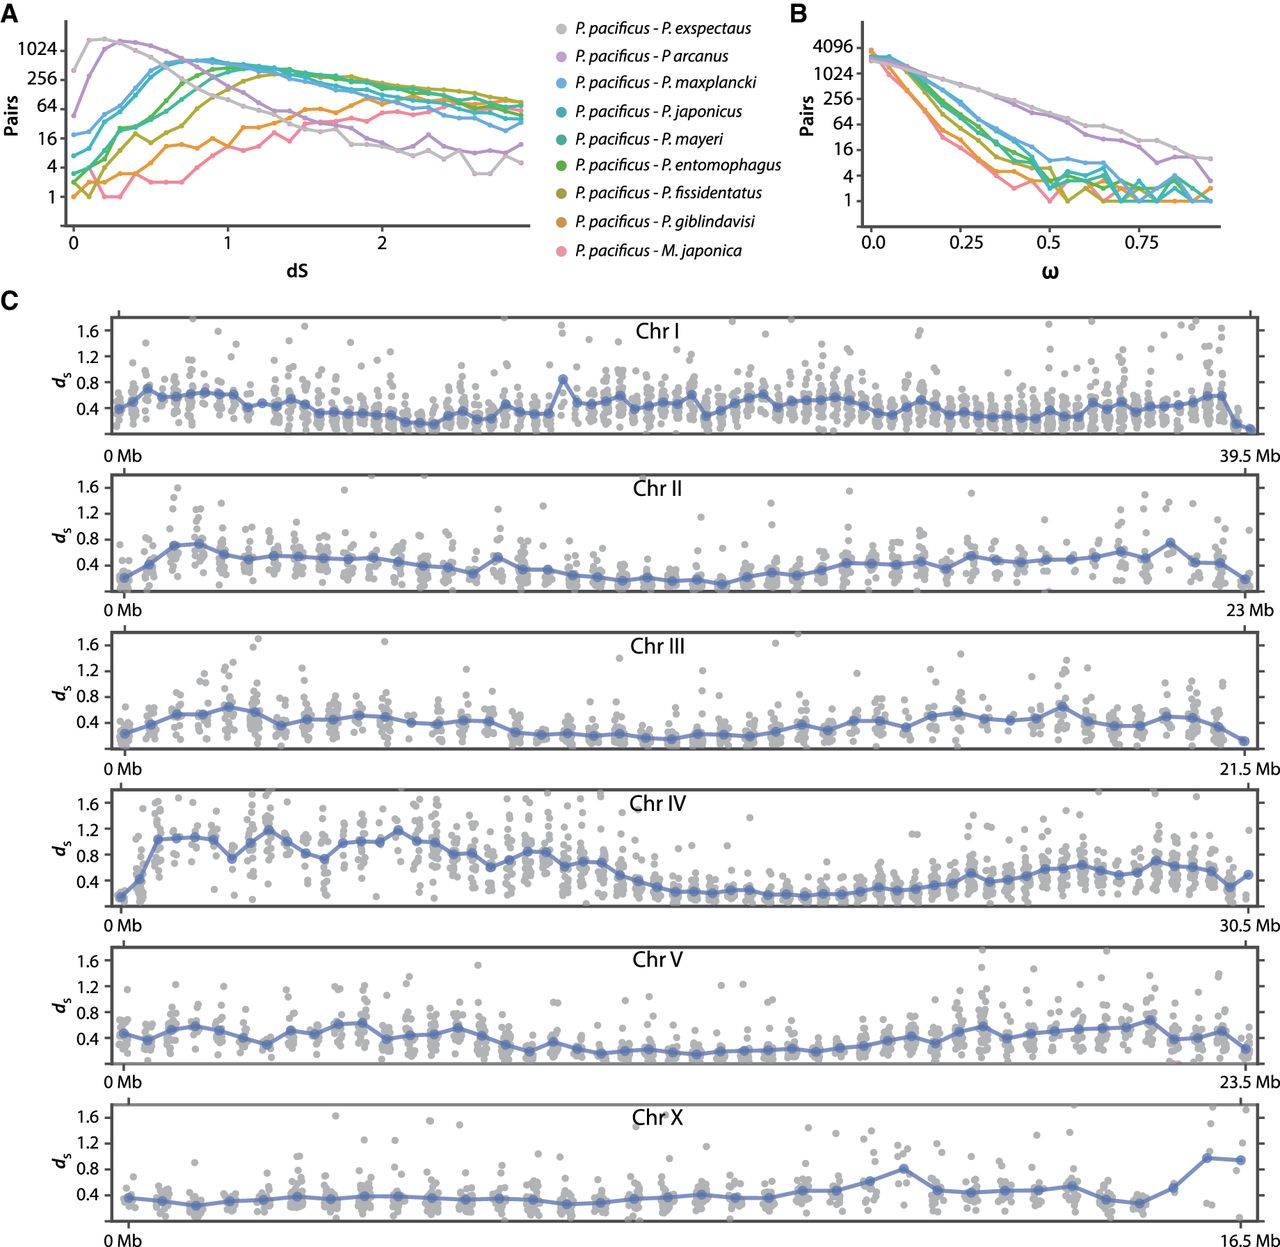
Figure 4.
Divergence estimates across different time scales and their chromosomal distribution. (A,B) Pairwise dS (A) and ω (B) distribution between P. pacificus and all other species support the underlying species phylogeny (Susoy et al. 2016). (C) dS value of each 1:1 ortholog between P. pacificus and P. exspectatus were mapped on the P. pacificus chromosomes with a running mean for each window (in blue).


