
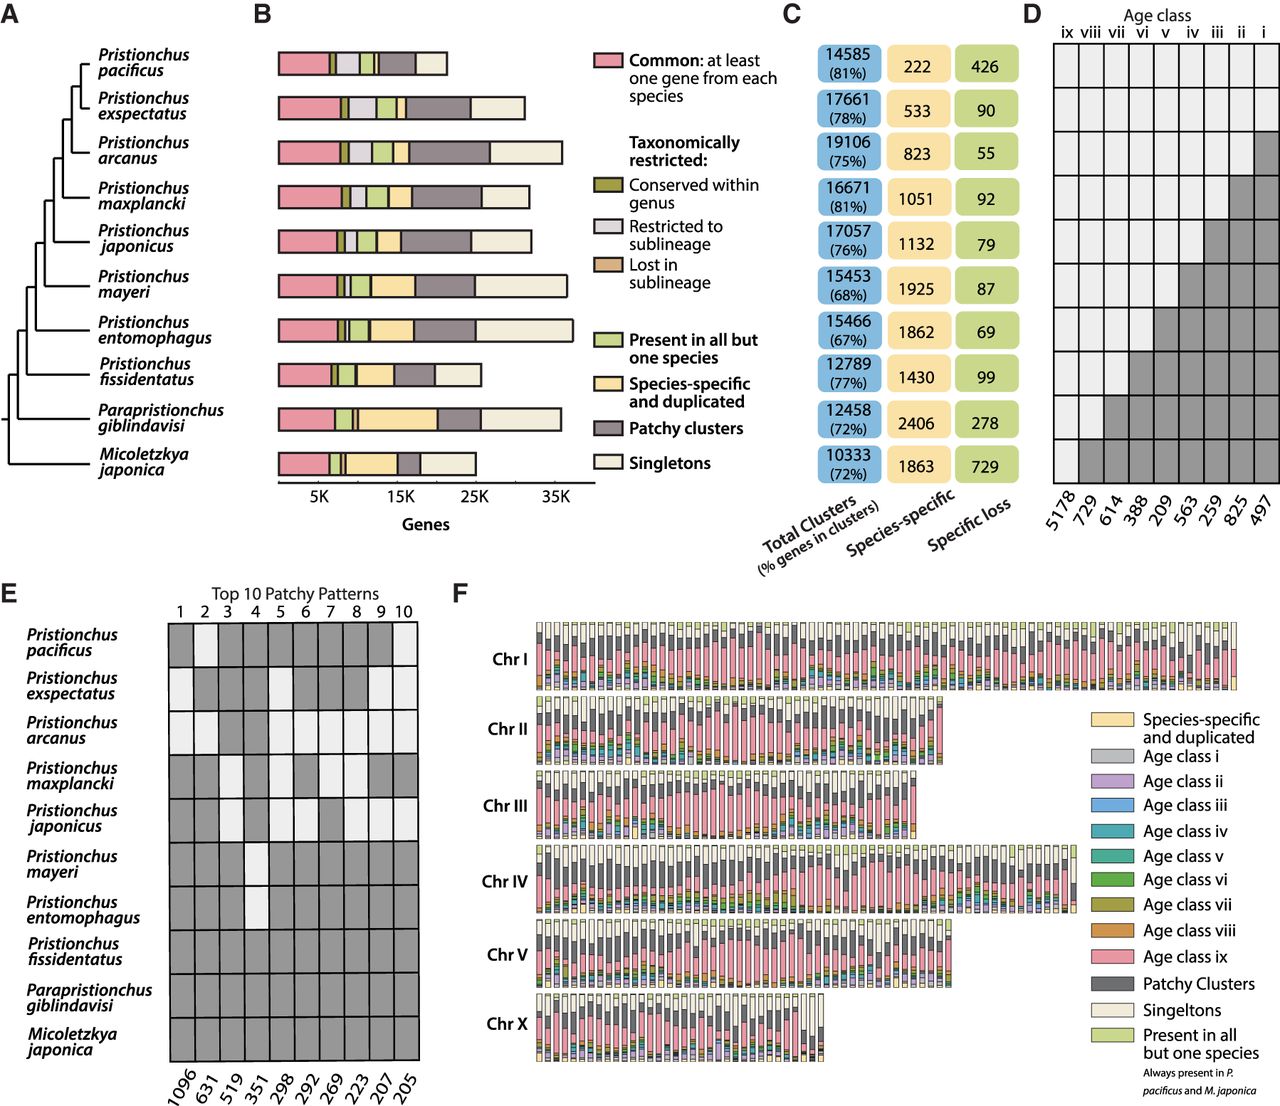
Gene classes of Pristionchus nematodes and their distribution on P. pacificus chromosomes. (A) Overview of phylogenetic relationship among the 10 diplogastrid species. (B) Distribution of genes within orthology classes across 10 diplogastrid genomes. (C) Numbers of total clusters per species and the percentage of all genes within these clusters, followed by the number of species-specific clusters and clusters that have been exclusively lost in the given species. (D) Graphical representation of the age classes; a light rectangle indicates presence of a gene family in the given species, and a dark rectangle indicates absence of this gene family. The roman numerals at the top of the box indicate the relative age of the age class. (E) Top 10 species distribution patterns in patchy clusters. (F) Distribution of all orthology classes in nonoverlapping 500-Mb windows across chromosomes suggests that older genes are overrepresented at the chromosome centers. Chromosome II, III, IV, and V have their centers at the middle, Chromosome I has two chromosome centers, and Chromosome X has no obvious center.


