
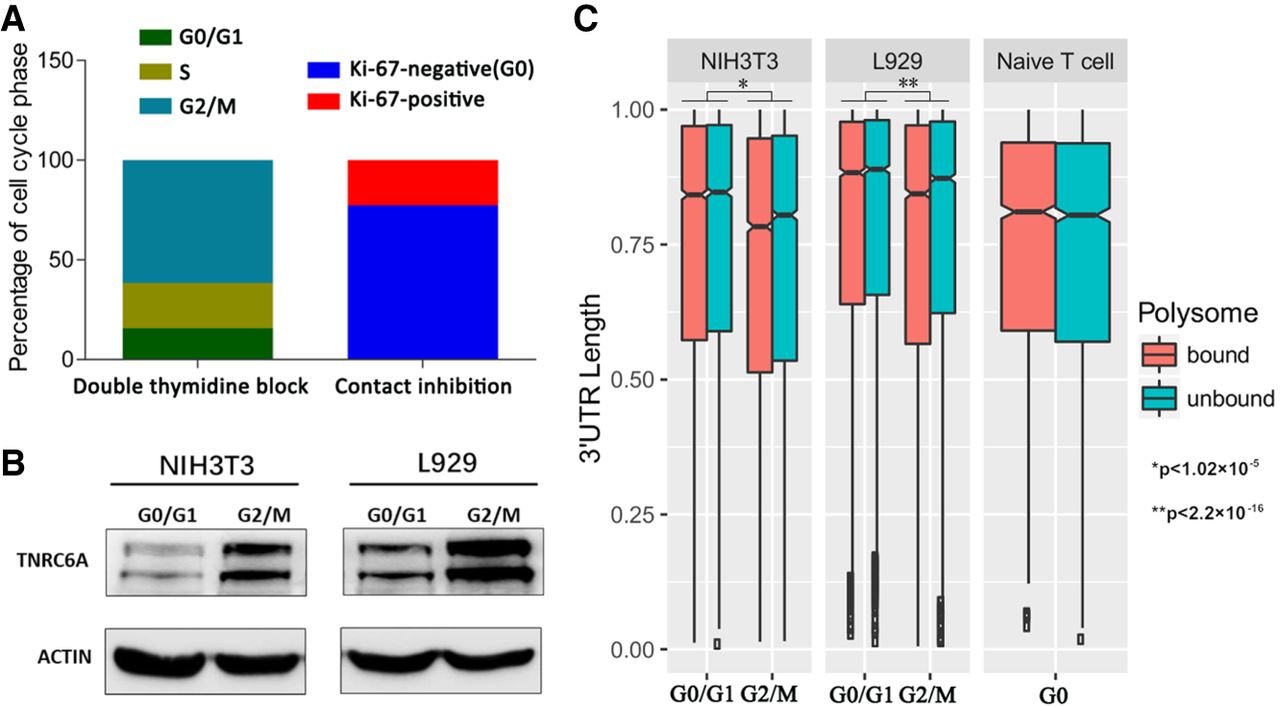
Figure 5.
Cell cycle and translational efficiency. (A) The percentage of cells in a cell cycle phase of the NIH3T3 cell line after cell synchronization with a double thymidine block and release, and contact inhibition. (B) Western blot analysis shows higher expression of TNRC6A in the G2/M phase in the NIH3T3 and L929 cell lines. (C) Notched box plot of the weighted mean of the 3′ UTR length for NIH3T3 and L929 cells obtained by synchronization, and naïve T cells. Cells at the G2/M but not G0/G1 phase show a higher translational efficiency of mRNA with a shorter 3′ UTR.


