
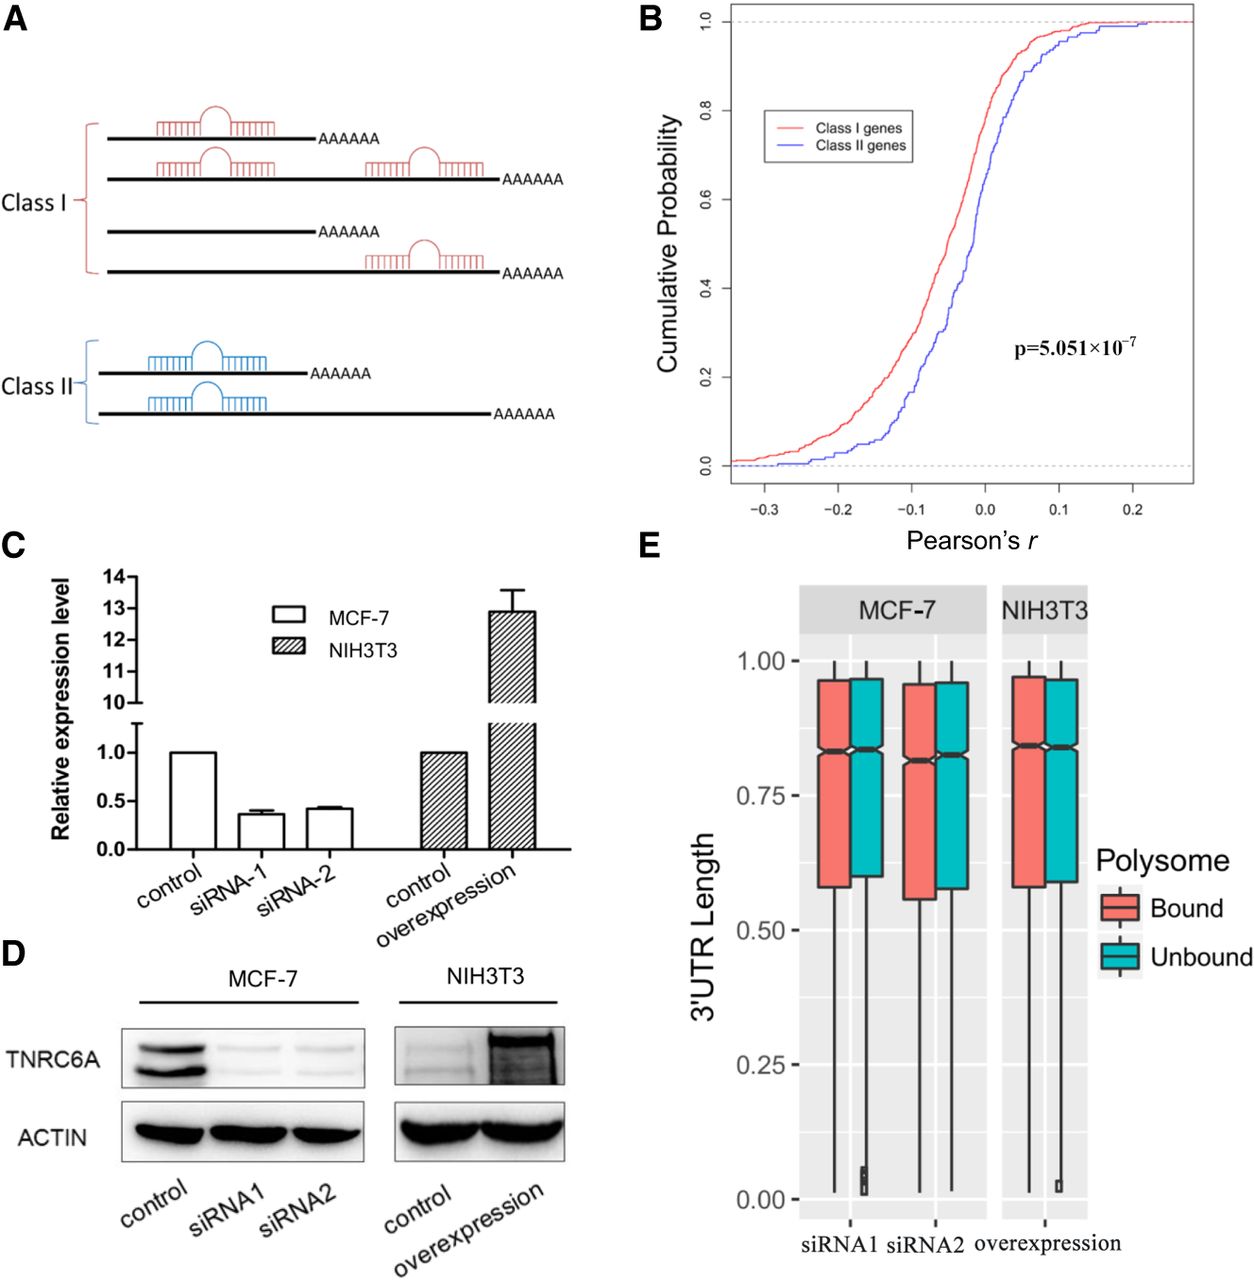
Figure 4.
miRNAs contribute to the translational efficiency difference between longer and shorter 3′ UTRs. (A) Genes were classified into two classes based on the position of miRNA targets and APA sites. (B) Cumulative distribution of Pearson's r in the test of linear trend alternative to independence. Statistically significantly smaller r-values were observed in Class I genes. (C,D) qRT-PCR and Western blot analysis of TNRC6A in the MCF-7 (knockdown) and NIH3T3 (overexpression) cell lines, respectively. (E) Notched box plot of the weighted mean of the 3′ UTR length for cells with the TNRC6A knockdown and overexpression.


