
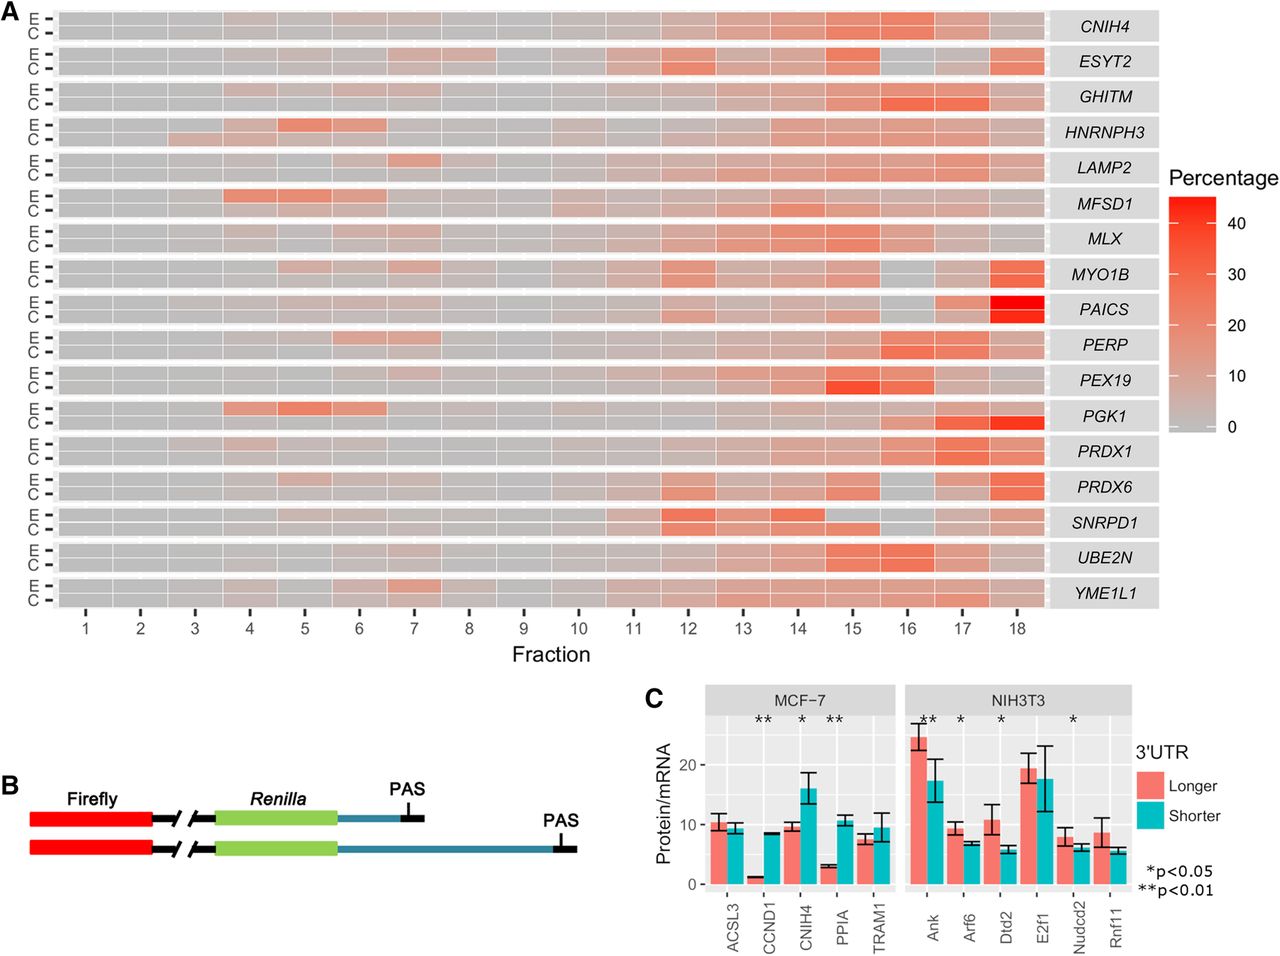
Validation of the translation efficiency difference between longer and shorter 3′ UTRs. (A) Heatmap of the proportion of mRNAs in polysome fractions measured by qRT-PCR. For each gene, two pairs of primers located in the common (C) and extended (E) regions of the 3′ UTR were designed to measure the expression levels of total and longer mRNA, respectively. (B) Scheme of the dual-luciferase reporter assay using the psiCHECK-2 Vector. Longer and shorter 3′ UTRs were cloned downstream from the Renilla ORF. Blue lines represent the inserted 3′ UTR. (C) Quantification of the Renilla protein/mRNA ratio (mean ± SE). The Renilla fluorescence and mRNA level were normalized to firefly fluorescence and the mRNA level, respectively. Student's t-test was performed to test the difference between longer and shorter 3′ UTRs.


