
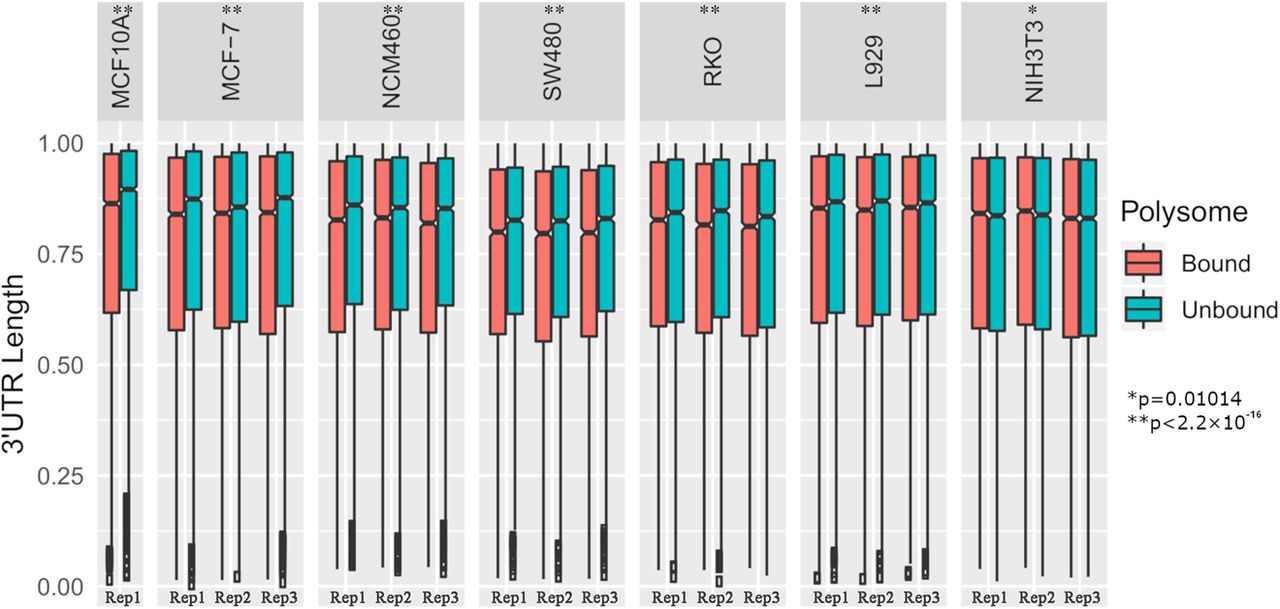
Figure 1.
Notched box plot of the weighted mean of the 3′ UTR length shows the translational efficiency difference of mRNAs with different 3′ UTR lengths. For each gene with UTR-APA, the length of each 3′ UTR isoform was normalized to the longest 3′ UTR, and the weighted mean of 3′ UTR length was calculated. P-values were obtained with the linear mixed model and F-test.


