
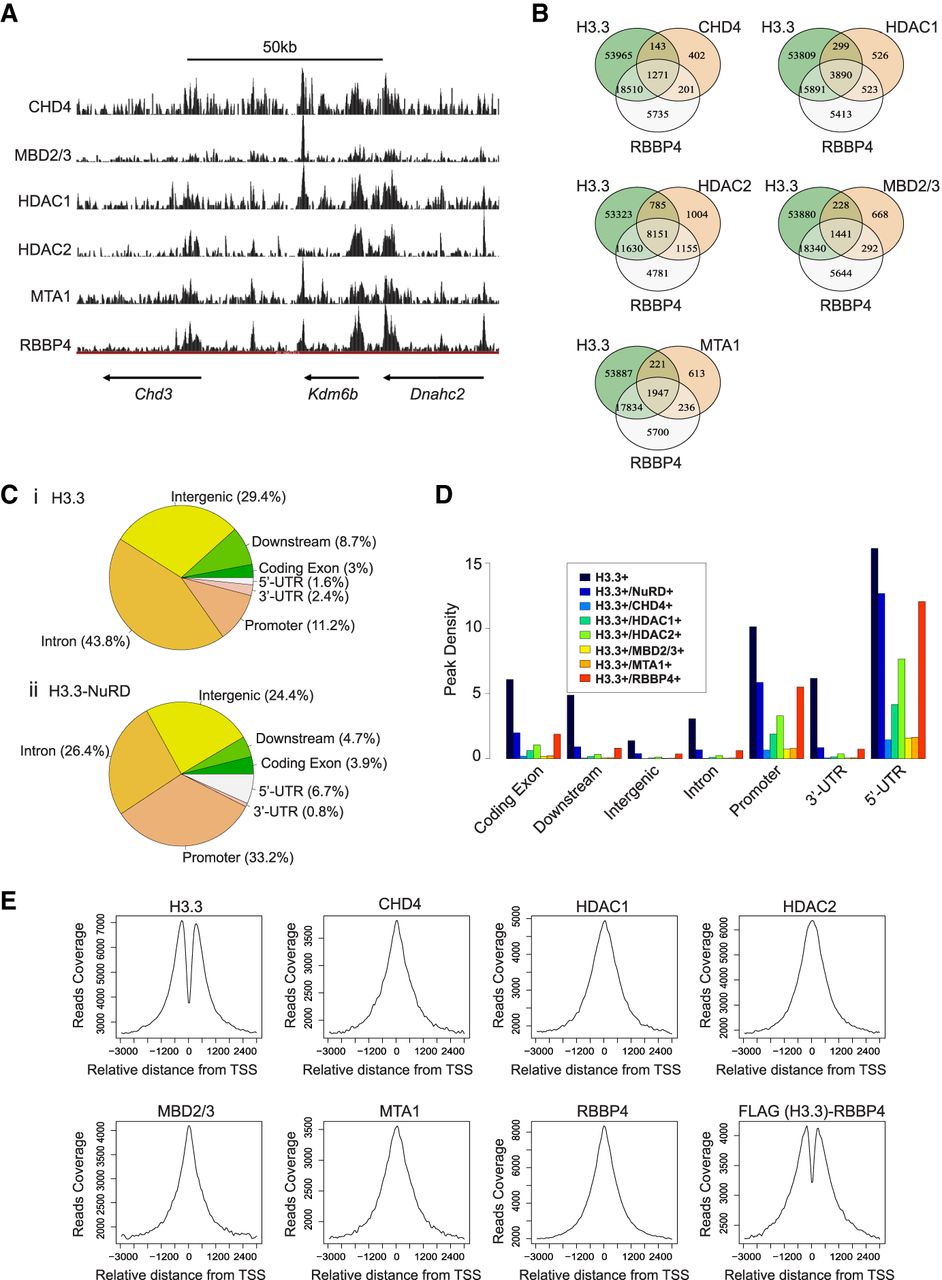
H3.3-NuRD interactions are prevalent at gene promoters. (A) Custom tracks generated from ChIP-seq data for NuRD subunits. (B) Venn diagrams illustrating overlap of enrichment between H3.3 and various NuRD subunits with P-value < 0.001 for all subunits. (C) Pie chart illustrating the distribution of H3.3 peaks (i) and H3.3-NuRD peaks (ii) across various functional genomic regions. NuRD enrichment was defined as MTA1 and/or MBD2/3 peaks that overlap with RBBP4. (D) Bar graph illustrating the relative distribution of H3.3-NuRD interactions across various functional genomic regions. Enrichment levels were normalized over the total length of the genomic region. NuRD enrichment was defined as MTA1 and/or MBD2/3 peaks that overlap with RBBP4. (E) H3.3 and NuRD subunit enrichment profiles at ±3 kbp of TSSs. Last panel depicts enrichment of H3.3/RBBP4 complexes generated from sequential FLAG-H3.3-RBBP4 ChIP-seq experiments.


