
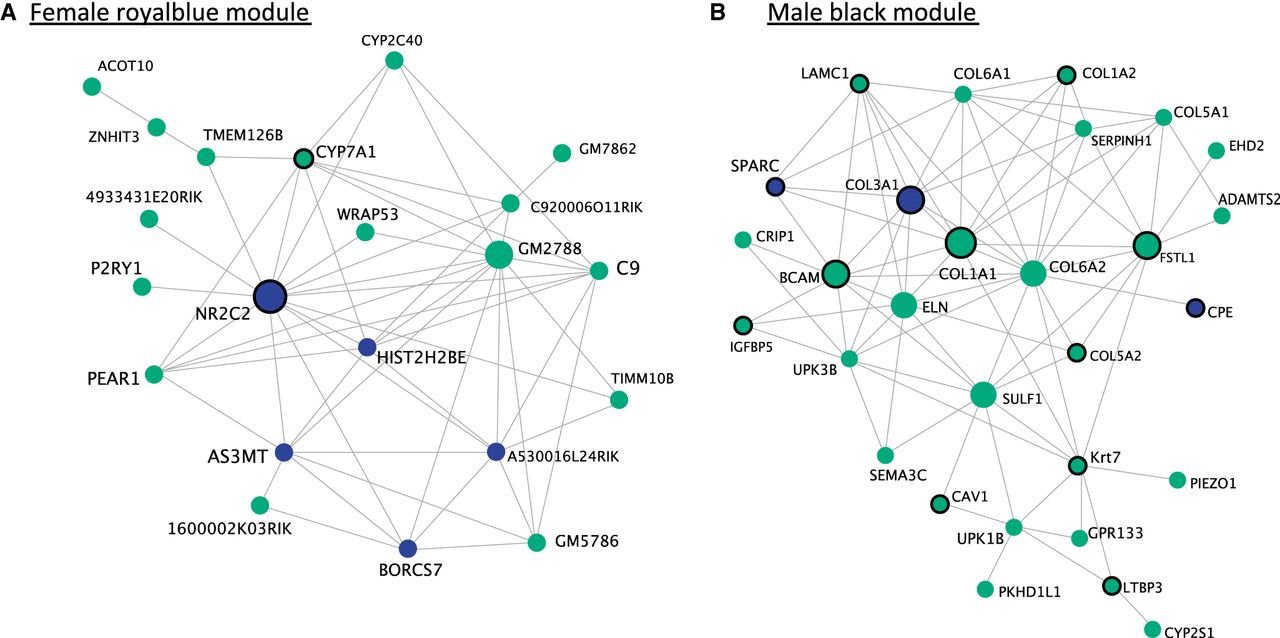
Figure 4.
Visualization of the most connected genes in the female “royalblue” (A) and the male “black” (B) co-expression modules with VisANT (Hu et al. 2008). The royalblue module is associated with BMI (P = 2 × 10⁻⁸) and body length variation (P = 6 × 10⁻⁶). The black module is associated with BMI (P = 5 × 10⁻⁸), body mass (P = 0.001), and body length variation (P = 3 × 10⁻¹⁰). Blue circles represent genes for which we identified a cis-eQTL that explains a component of expression variation. Circles with black borders are genes with mutant phenotypes related to body size or metabolism. Phenotype information was collected from MGI (Blake et al. 2017).


