
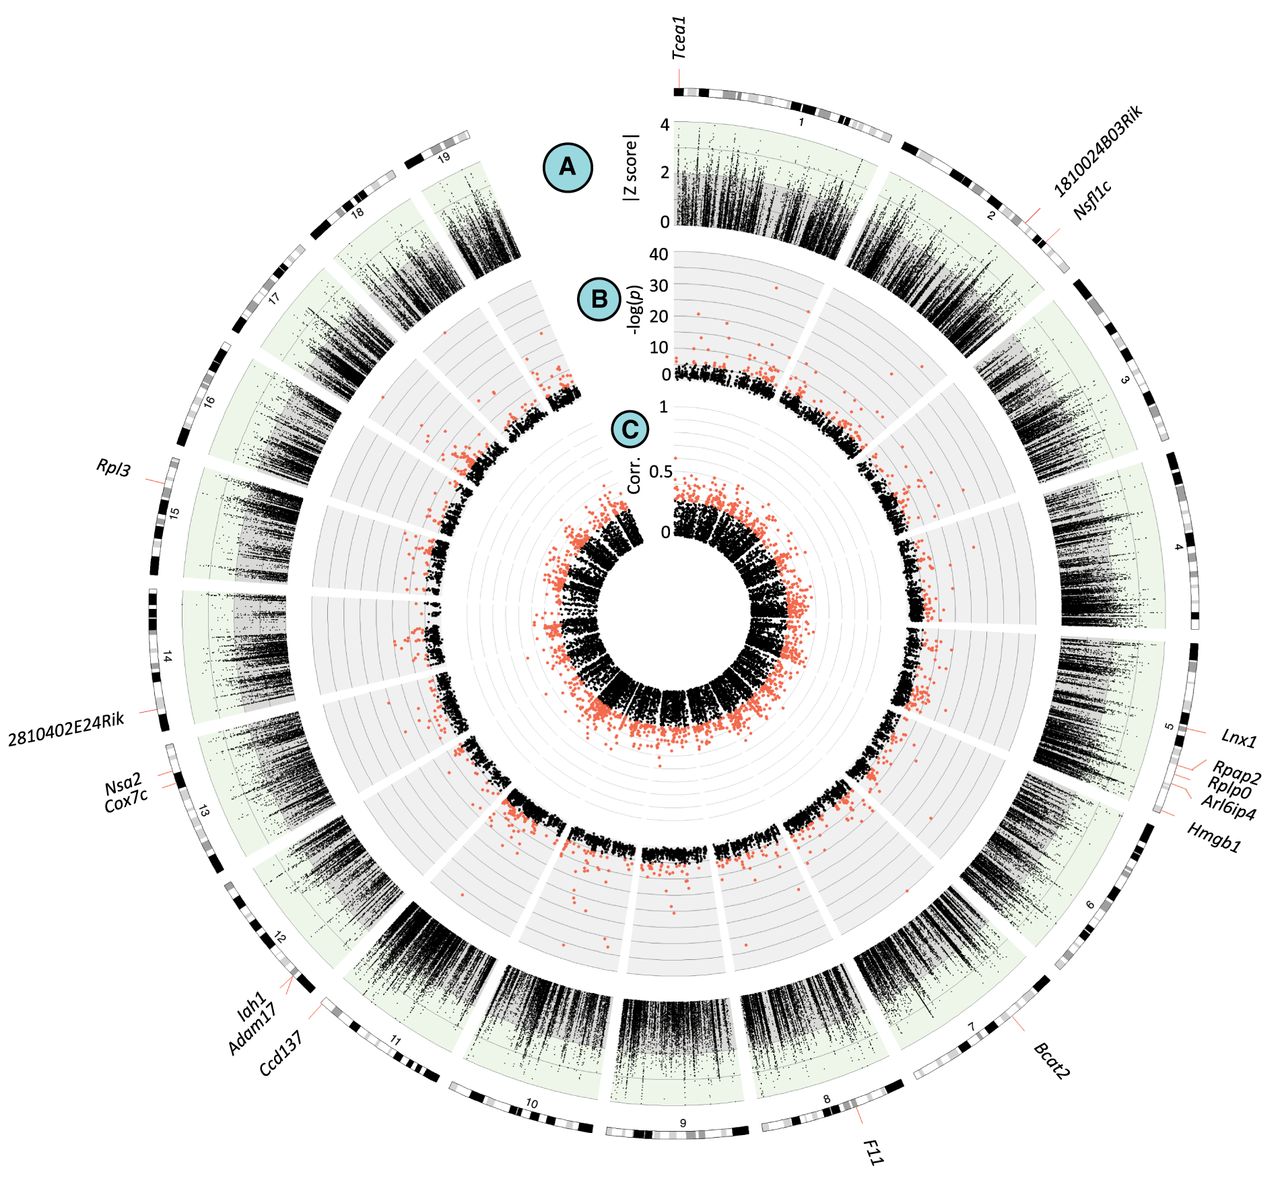
Figure 2.
Overlap between genomic scans identifies regulatory variants that are candidates for clinal adaptation. (A) The LFMM |z-scores| for each SNP vs. chromosome position. SNPs with |z-scores| > 2 were considered clinal outliers. (B) Manhattan plot of cis-eQTL. Shown in red are significant SNPs. (C) Manhattan plot of gene starting position versus the correlation between gene expression and latitude. Points labeled in orange are genes for which expression is significantly correlated with latitude (P < 0.05). On the outside are ideograms with the location of genes for which these three signals (A–C) overlap. Figure created with Circos (Krzywinski et al. 2009).


