
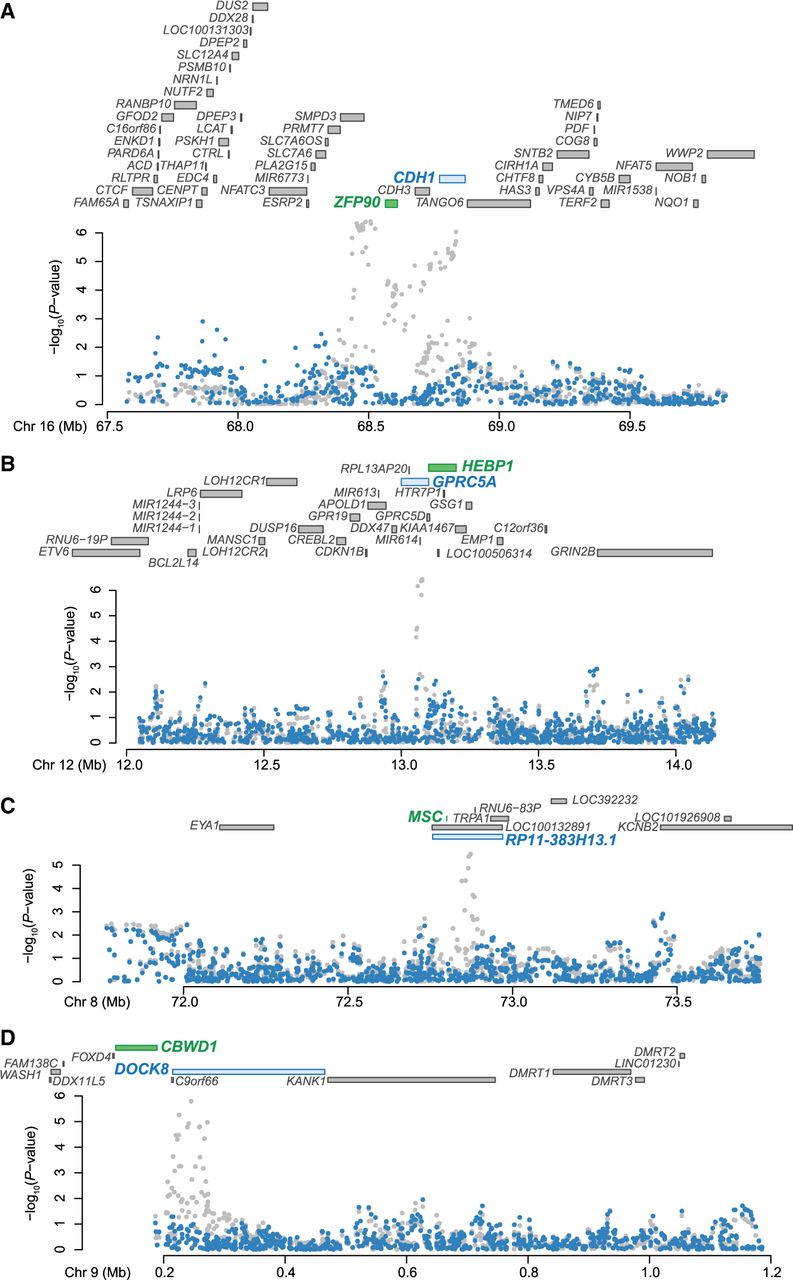
TWAS using melanocyte eQTL data as a reference set identified five new melanoma-associated genes in four new loci. (A) The new melanoma TWAS gene, ZFP90 on Chromosome 16 (TWAS P = 1.95 × 10⁻⁷, TWAS Z = 5.2) is shown in green, along with a second marginally significant gene, CDH1 (P = 5.27 × 10⁻⁴, Z = 3.47) in blue, and other annotated genes at the locus (coordinates are hg19). The Manhattan plot presents the melanoma GWAS P-values before (gray) and after (blue) conditioning on imputed melanocyte-specific gene expression of the gene in green (ZFP90 in this locus). (B) A similar plot for the melanoma TWAS gene HEBP1 (TWAS P = 4.65 × 10⁻⁷, TWAS Z = −5.04) and a second marginally significant gene, GPRC5A (TWAS P = 2.8 × 10⁻⁵, TWAS Z = −4.19) on chromosome band 12p13.1. (C) A similar plot for two new melanoma TWAS genes, MSC (P = 4.27 × 10⁻⁶, Z = 4.6) and RP11-383H13.1 (P = 6.68 × 10⁻⁶, Z = 4.5) on chromosome band 8q13.3. The Manhattan plot shows the melanoma GWAS P-values before (gray) and after (blue) conditioning on imputed melanocyte-specific gene expression of MSC. (D) A similar plot of new melanoma TWAS gene, CBWD1 (P = 5.52 × 10⁻⁶, Z = −4.54) and a marginally significant gene, DOCK8 (P = 2.7 × 10⁻³, Z = 2.99) on chromosome band 9p24.3.


