
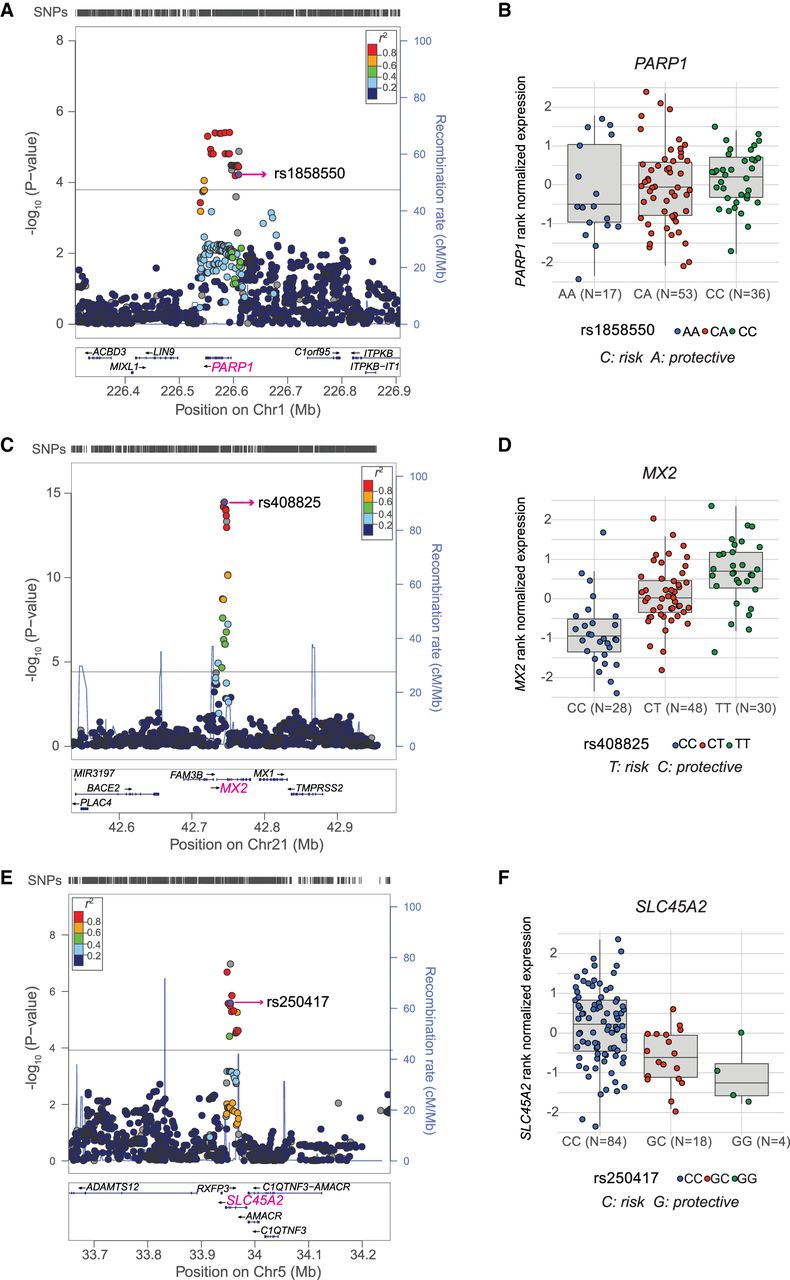
Melanoma GWAS signals colocalizing with melanocyte eQTLs. (A,C,E) LocusZoom plots present the nominal eQTL P-values of all tested local SNPs in 300- to 400-kb windows for three significant eQTL genes from three melanoma GWAS loci: (A) PARP1; (C) MX2; and (E) SLC45A2. The gene being measured is highlighted in pink, the index melanoma risk SNP is labeled and highlighted in purple, and r2 (based on 1000G EUR) of all other SNPs to the index SNP is color-coded. SNPs with missing LD information with the index SNP are shown in gray. Horizontal lines are shown for nominal P-value cutoffs for significant eQTLs. Genomic coordinates are based on hg19. (B,D,F) Boxplots present melanocyte expression differences of each gene in relation to the genotypes of the index SNP. Melanoma risk and protective alleles are shown for each locus.


