
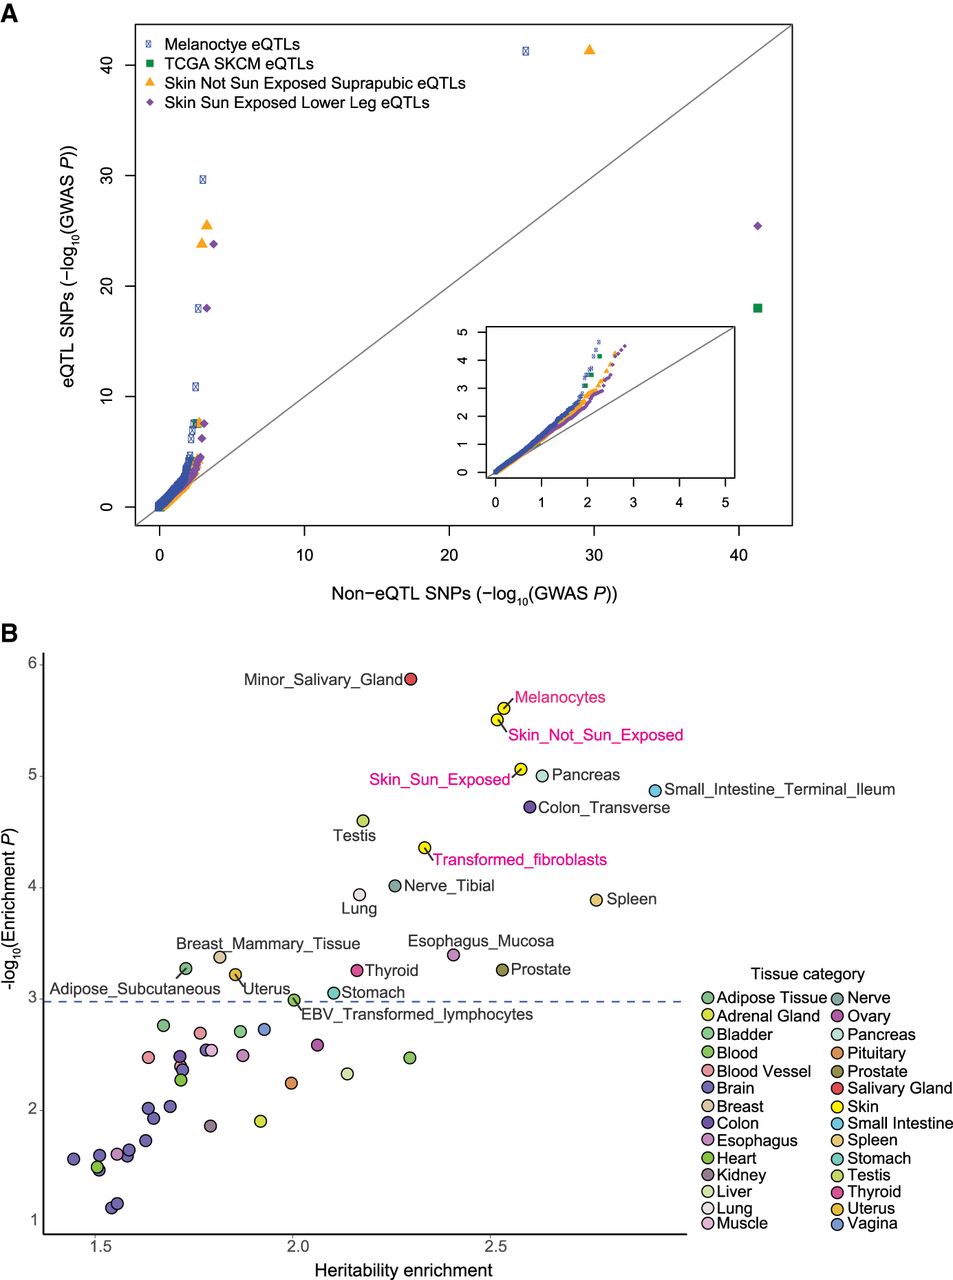
Melanoma GWAS signal is enriched in melanocyte-specific genes and eQTLs. (A) QQ plot presents melanoma GWAS LD-pruned P-values of significant eQTL SNPs versus non-eQTL SNPs for the melanocyte data set compared to those for sun-exposed skin, non-sun-exposed skin, and melanoma tumors. SNPs were classified as eQTL SNPs if they were significant eQTLs or in strong LD (r2 > 0.8) with an eQTL SNP (eQTL SNPs threshold: FDR < 0.05) in each data set. The inset displays a zoomed-in view of a lower −log10 GWAS P-value range (0–5 range for x- and y-axes). (B) Melanoma heritability enrichment levels and P-values in top 4000 tissue-specific genes from LD score regression analysis are displayed. The dashed horizontal line marks FDR = 0.05 on the y-axis. Names of significantly enriched individual tissue types are shown next to the data points, and the others are color-coded based on GTEx tissue category. Tissue types from the “Skin” category including melanocytes are highlighted in pink.


