
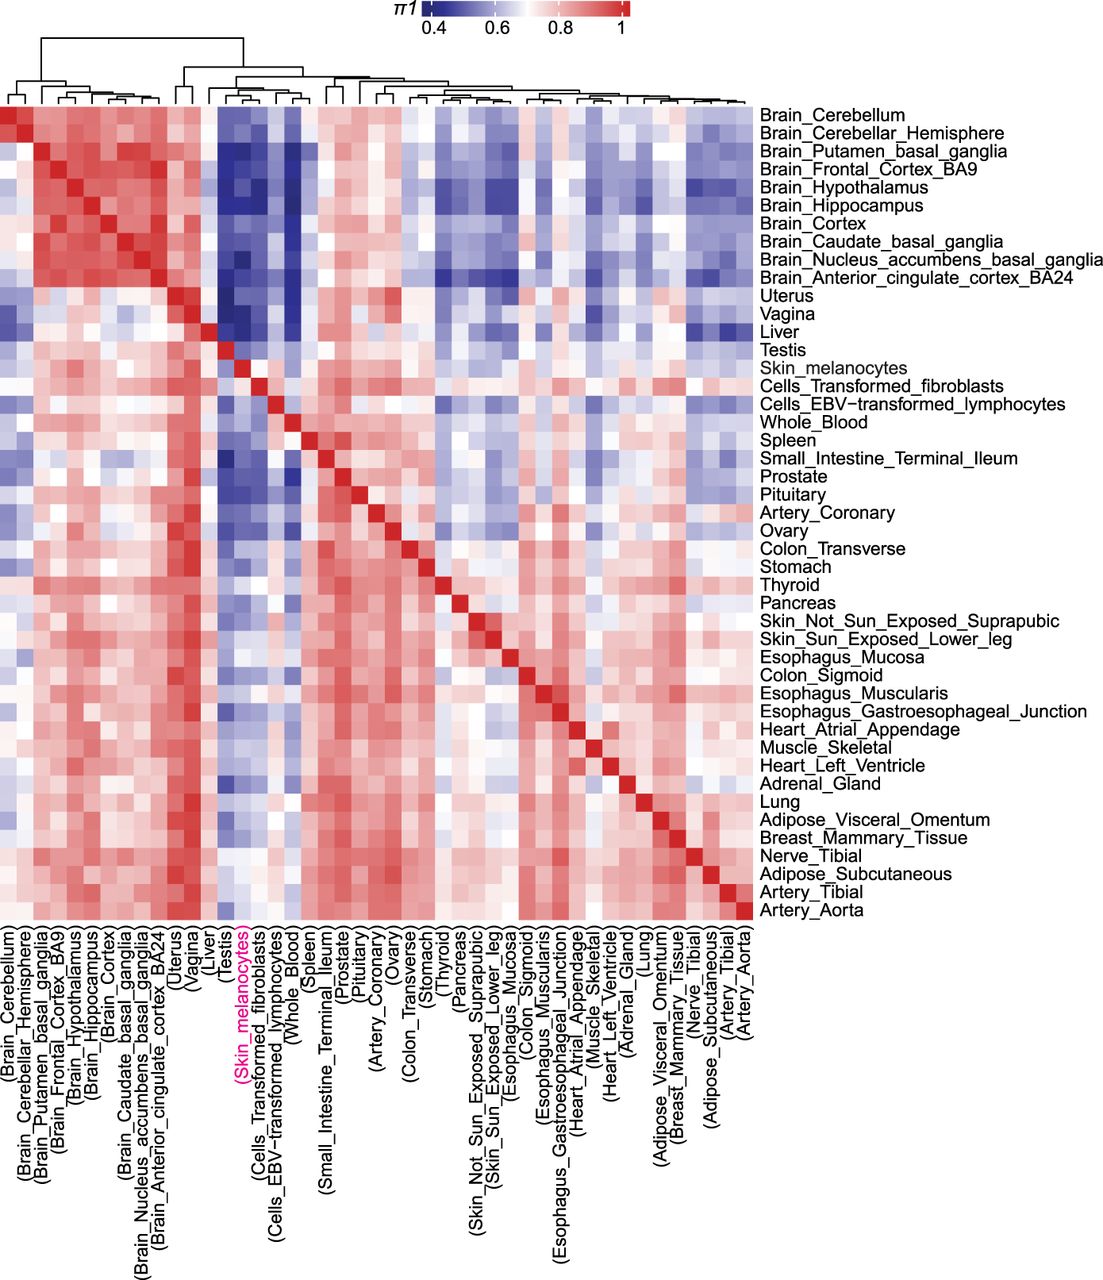
Melanocyte eQTLs display a distinct pattern from those of 44 GTEx tissue types. Dendrogram and heat map presenting the sharing of eQTLs between human primary melanocytes and 44 other GTEx tissue types. Pairwise π1 statistics were calculated from single-tissue eQTL discoveries in each tissue using all the genome-wide significant eQTL SNP-gene pairs. π1 is only calculated when the gene is expressed and testable both in discovery (columns) and replication (rows) tissues. Higher π1 values indicate an increased replication of eQTLs between two tissue types. π1 values range between ∼0.41 and 1 and are color-coded from blue (low sharing) to red (high sharing). Tissues are clustered using the Spearman's correlation of π1 values. Note that π1 values are not symmetrical, since each entry in row i (replication tissue) and column j (discovery tissue) is an estimate of π1 = Pr (eQTL in tissue i given an eQTL in tissue j). Discovery tissue names are shown in parentheses on the bottom. The position of the skin melanocyte eQTL data set from the discovery tissues is shown in pink.


