
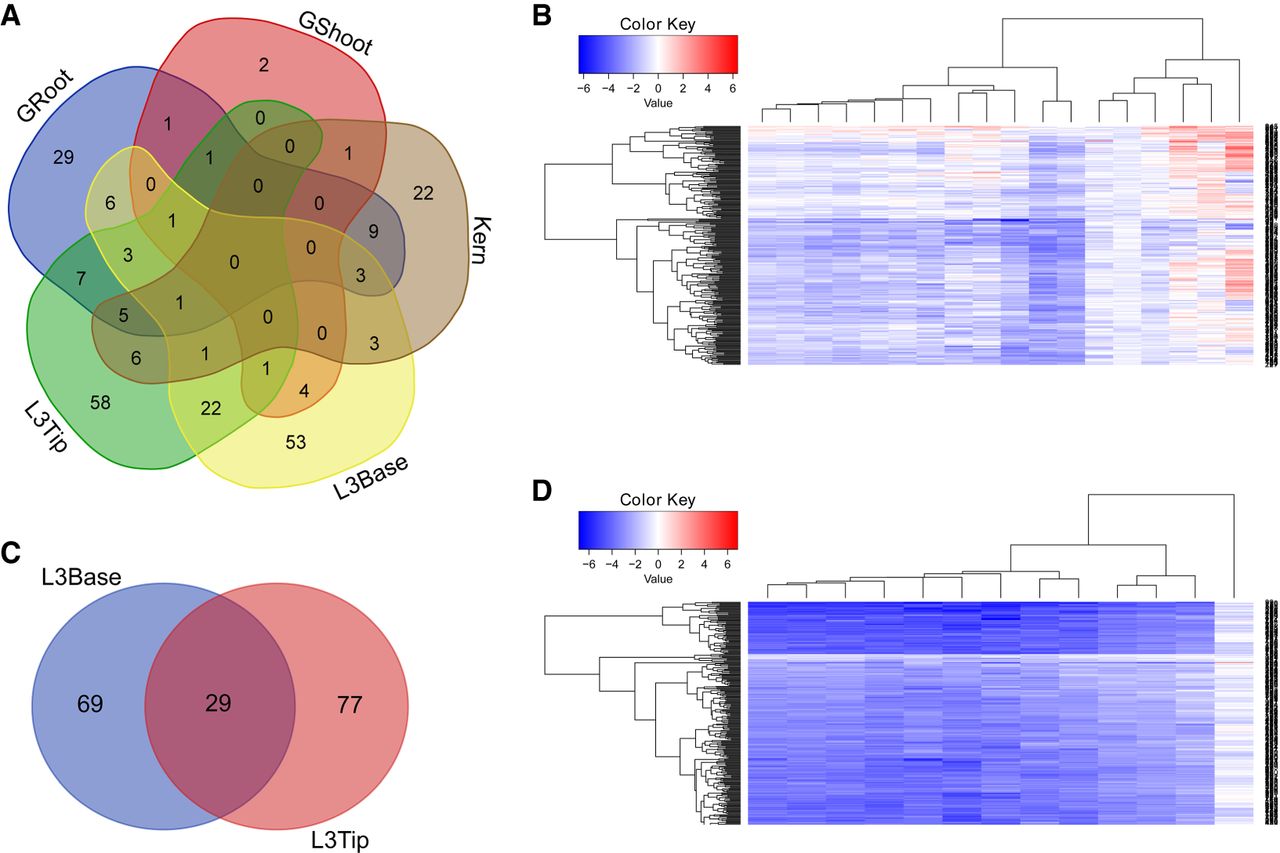
Tissue-specific expression of r-protein genes. (A) Venn diagram shows shared r-protein genes among different tissues. (B) The expression pattern of 17 shared r-protein genes with same direction of correlation with rRNA between L3Base and L3Tip, suggesting that most genes in most maize lines show decreased expression from L3Base to L3Tip. (C) Twenty-nine r-protein genes were identified to be shared between L3Base and L3Tip. (D) The expression pattern of 12 shared r-protein genes, which show different directions of correlation with rRNA expression between L3Base and L3Tip. Similarly, these genes also showed decreased expression levels. Color key indicates log2 (E1/E2), where E1: rpm (reads per million) (L3Base); E2: rpm (L3Tip) for each gene. The blue bar indicates an expression level decrease, and the red bar indicates an expression level increase. Gene details can be found in Supplemental Table S15.


