
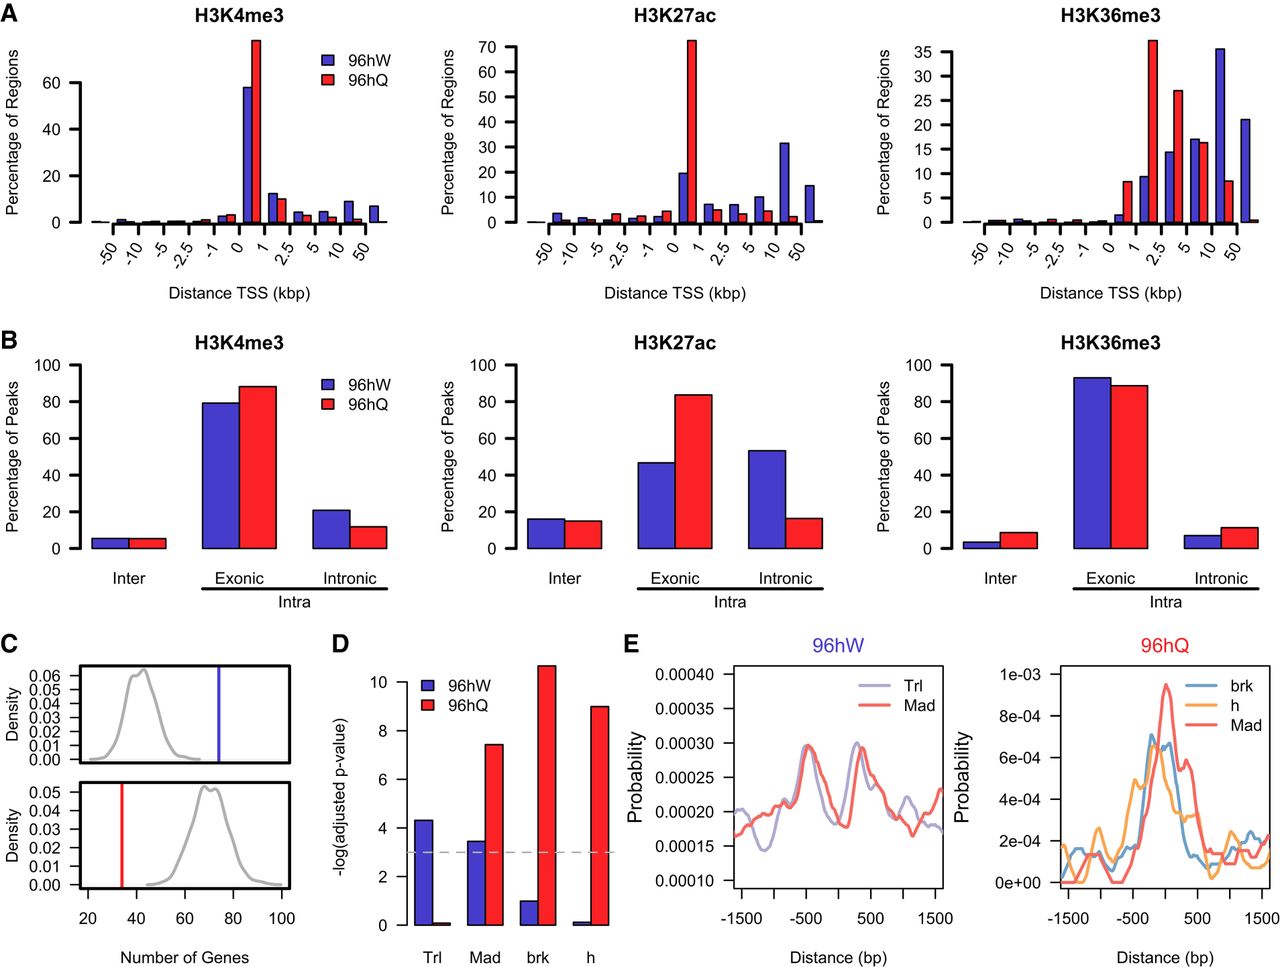
Intronic H3K27ac regions define the worker caste and are enriched for transcription factor binding sites. (A) A bar plot showing the percentage of unique H3K4me3, H3K27ac, and H3K36me3 ChIP-seq regions and their location relative to the nearest TSS in 96hW (blue) and 96hQ (red). (B) A bar plot showing the percentage of unique H3K4me3, H3K27ac, and H3K36me3 ChIP-seq regions within intergenic or intragenic locations. Intragenic distributions are further defined as either exonic or intronic. The blue bar represents regions with higher enrichment in 96hW, and the red bar are those regions with higher enrichment in 96hQ. (C) In the top panel, the vertical blue line shows the number of differentially expressed genes that contain at least one peak of intronic H3K27ac and are more expressed in 96hW compared to 96hQ. A background distribution (shown in gray) was calculated by randomly selecting an identical number of genes and calculating how many of these contain at least one peak of intronic H3K27ac. This was repeated 1000 times. In the bottom panel, the vertical red line shows the number of differentially expressed genes that contain at least one peak of intronic H3K27ac and are more expressed in 96hQ compared to 96hW. A background distribution (shown in gray) was calculated as previously and repeated 1000 times. (D) A bar plot of the adjusted P-value for enrichment of transcription factor binding motifs located within caste-specific intronic H3K27ac regions. (E) A motif probability graph showing the probability of transcription factor binding motifs in relation to caste-specific intronic H3K27ac (centered at 0 bp).


