
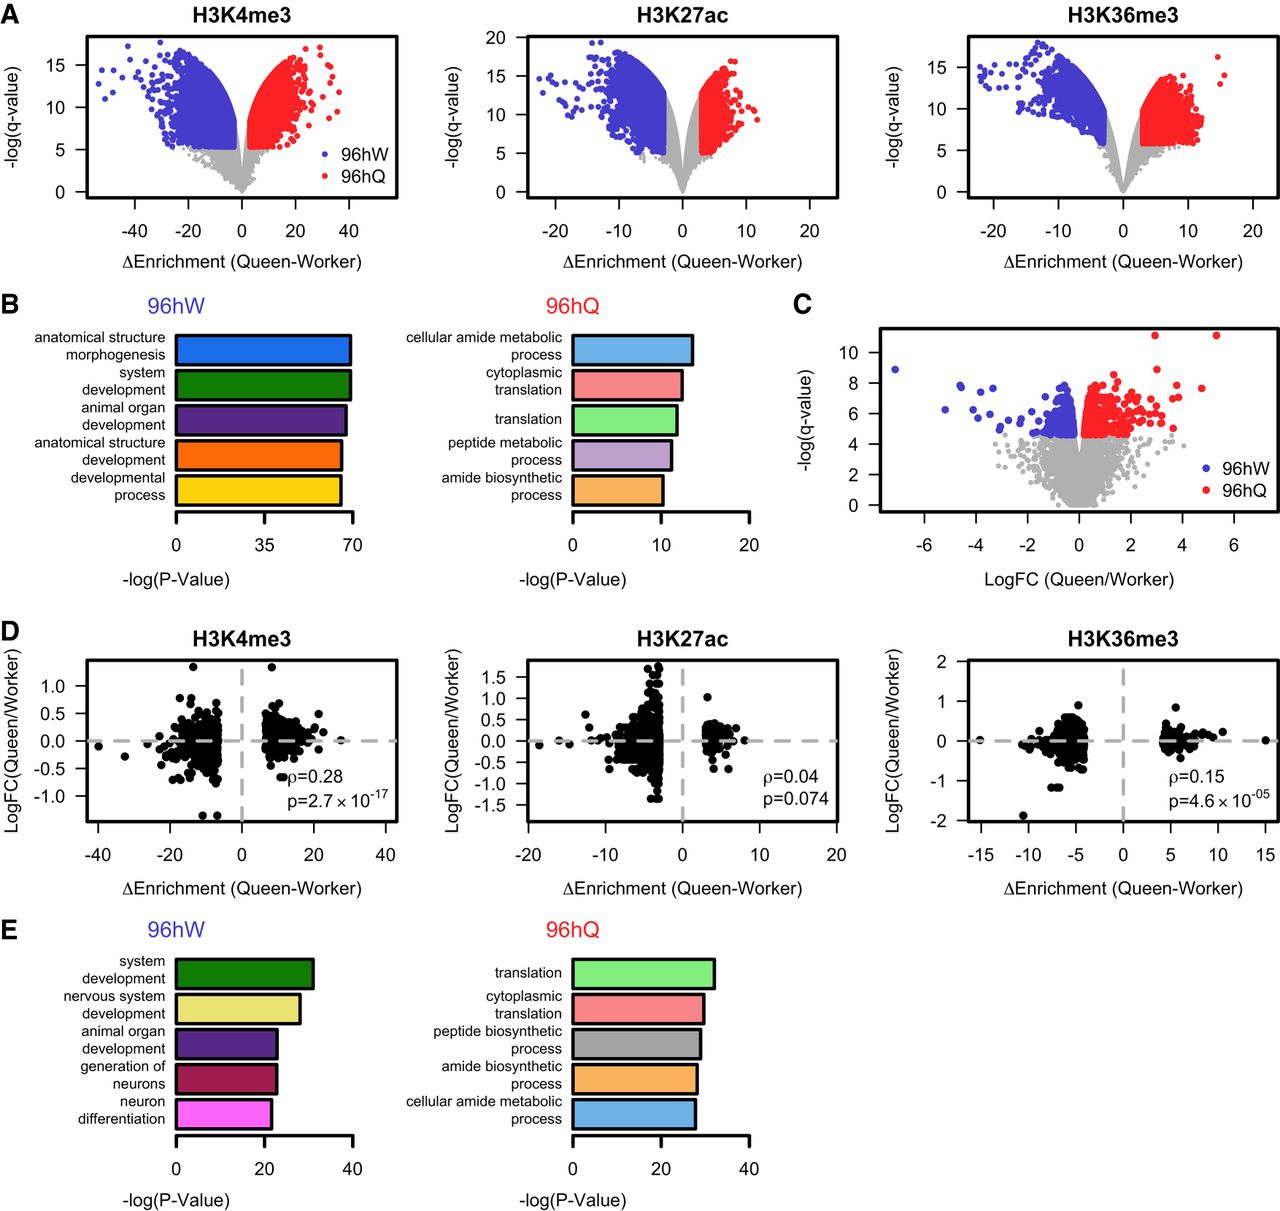
At 96 h, worker and queen larvae show caste-specific differences in the enrichment of H3K4me3, H3K27ac, and H3K36me3 that correlate with differential gene expression. (A) A volcano plot of the difference in enrichment between 96hW and 96hQ castes against the negative log q-value for H3K4me3, H3K27ac, and H3K36me3. Regions in gray fall below the genome-wide threshold of significance (P > 0.01). Regions in blue (96hW) and red (96hQ) are those that reach genome-wide significance (P ≤ 0.01) and have a greater than threefold difference in enrichment above input between castes. (B) The negative log P-value for the top five biological process GO terms for those genes which show increased enrichment for H3K4me3, H3K27ac, or H3K36me3 in 96hW compared to 96hQ (left) and for those which show an increased enrichment in 96hQ compared to 96hW (right). (C) A volcano plot of the log fold change (LogFC) in transcript expression by RNA-seq between 96hW and 96hQ castes against the negative log q-value. Transcripts in gray fall below the genome-wide threshold of significance (P > 0.01); transcripts in blue reach genome-wide significance (P ≤ 0.01) and are more expressed in 96hW; transcripts in red reach genome-wide significance (P ≤ 0.01) and are more expressed in 96hQ. (D) A scatter plot of the difference in significant ChIP-seq enrichment between 96hQ and 96hW (x-axis) against the LogFC of transcript expression between 96hQ and 96hW castes (y-axis). (E) The negative log P-value for the top five biological process GO terms for those transcripts that show both increased expression and increased enrichment in H3K4me3, H3K27ac, or H3K36me3 in 96hQ compared to 96hW (left) and for those that show both increased expression and increased enrichment in 96hQ compared to 96hW (right).


