
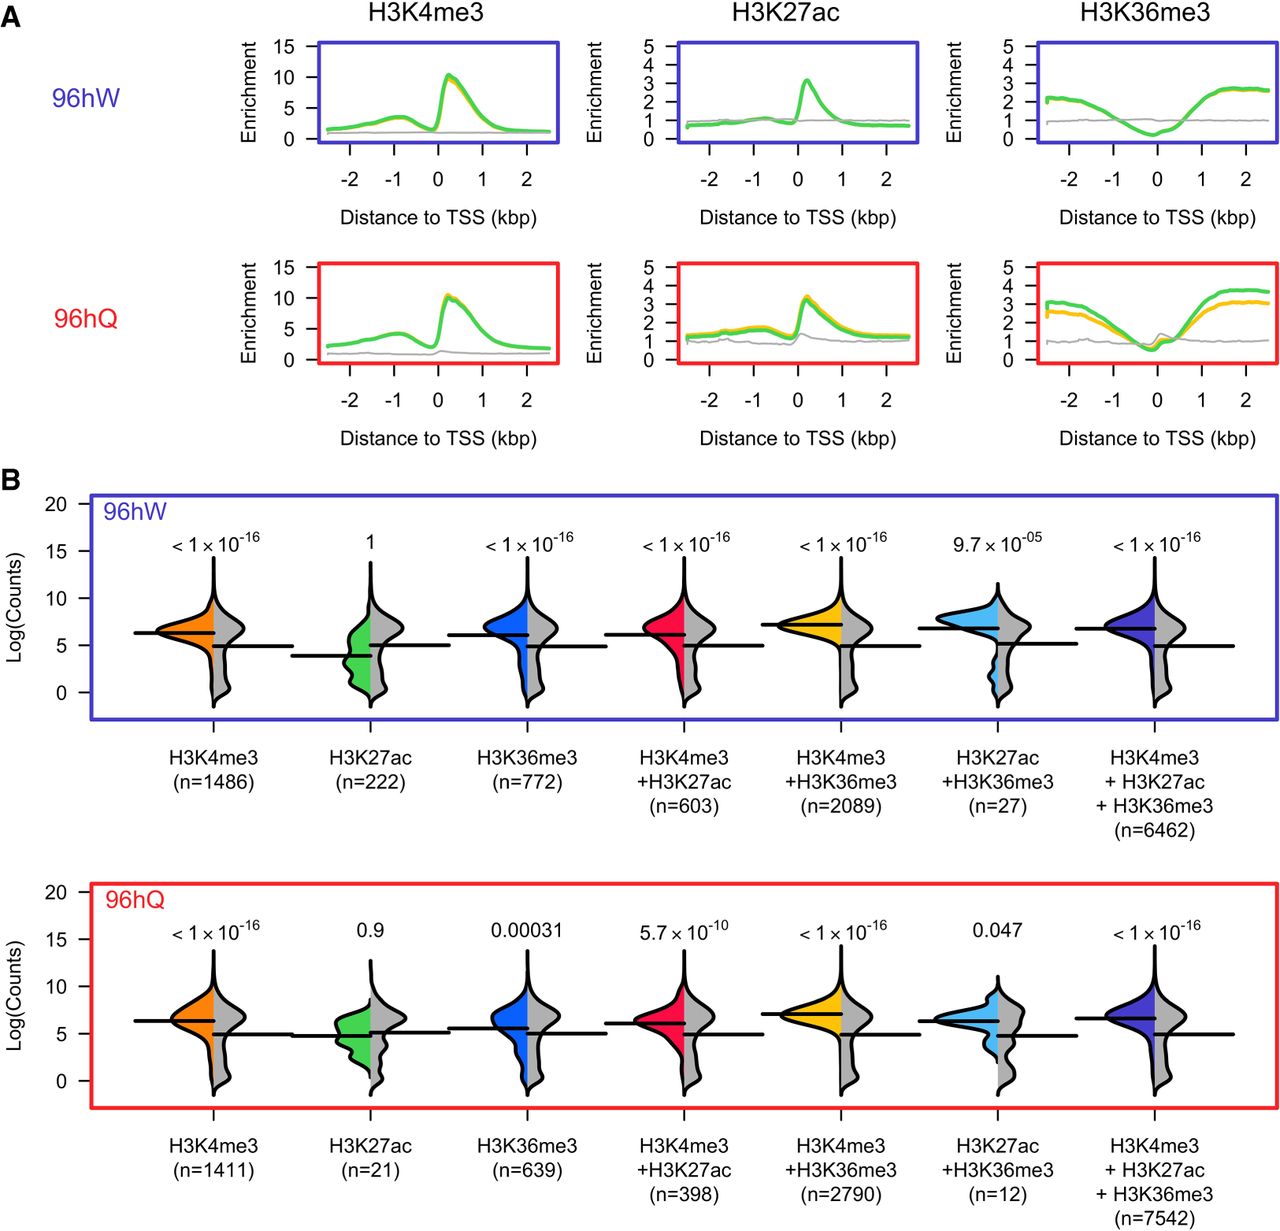
H3K4me3, H3K27ac, and H3K36me3 are associated with transcribed regions in honey bee castes. (A) Plots of the average ChIP-seq enrichment above input around the TSS (±2 kbp) of genes profiled across 96hW (upper) and 96hQ (lower). The green and yellow lines represent the two replicates performed for each ChIP-seq experiment, and the gray line represents the input. (B) The expression distribution (shown by a colored half-bean) of transcripts enriched by greater than threefold change above input for all possible combinations of H3K4me3, H3K27ac, and H3K36me3, compared to a random sampling of genes (gray half-bean). The mean of either distribution is shown by a solid black line; 96hW is shown in the top panel; 96hQ in the bottom panel; n is the number of transcripts.


