
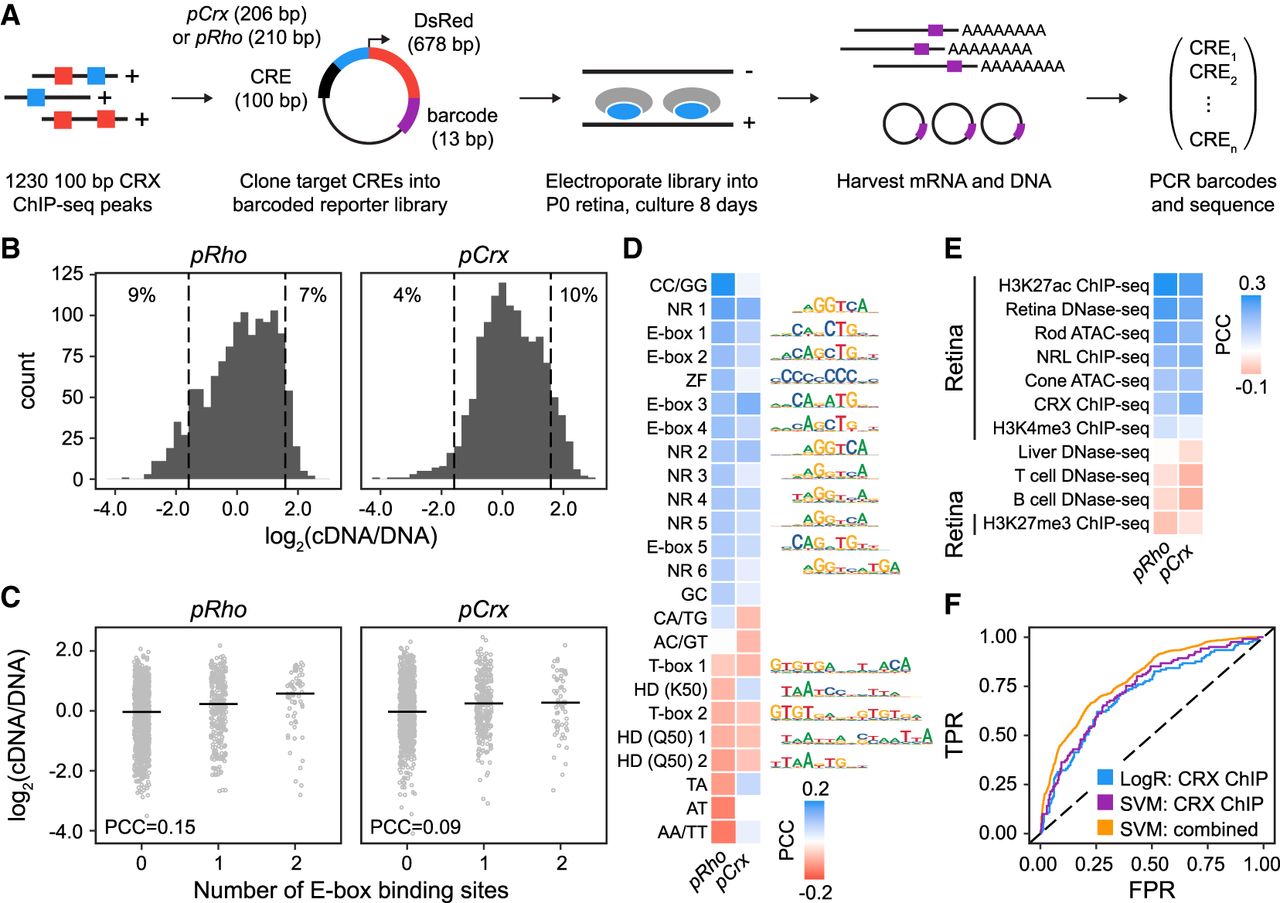
Primary sequence features are correlated with CRE activity in vivo. (A) Schematic of experimental approach: 100-bp elements centered on CRX ChIP-seq peaks were cloned upstream of a photoreceptor promoter driving DsRed with CRE-specific barcodes. Constructs were electroporated into P0 mouse retina and cultured for 8 d, at which point RNA and DNA were harvested and barcodes were amplified and sequenced to quantify activity. (B) Distribution of activity of elements assayed on either pRho or pCrx. Data are median-centered. (Dashed lines) Threefold decrease or increase relative to median. The percentage of constructs with activity above or below this threshold is indicated. (C) Correlation between number of E-Box binding sites and activity on pRho and pCrx. (D) Heatmap of Pearson correlation coefficients (PCCs) between specific dinucleotide frequencies or counts of TF binding sites and activity. Included features were significantly correlated with activity on at least one promoter. (E) Heatmap of Pearson correlations between genomic and epigenomic data sets and CRE activity. (F) Performance of specific models classifying elements with low (within 1.2-fold of the median) versus high (greater than threefold above the median) activity on pCrx. LogR (CRX ChIP) indicates logistic regression classifier using scores from logistic regression model trained on CRX ChIP-seq data (AUC-ROC = 0.71) (for full model, see Fig. 1D). SVM (CRX ChIP) indicates logistic regression classifier using scores from gkm-SVM classifier trained on CRX ChIP-seq data (AUC-ROC = 0.74). SVM (combined) indicates logistic regression classifier using scores from gkm-SVM models trained on genomic and epigenomic data sets listed in Supplemental Table 3 (AUC-ROC = 0.80). (Dashed line) Performance of a random classifier.


