
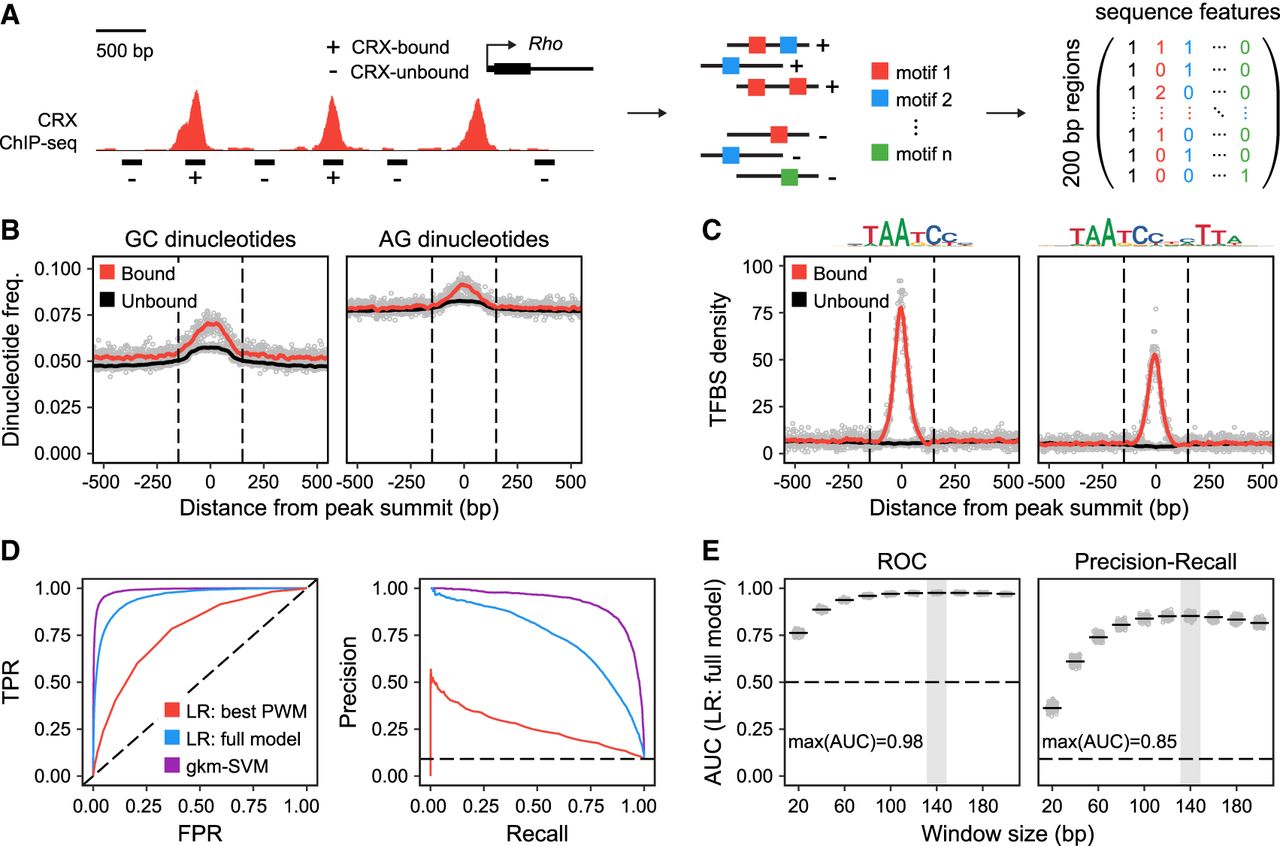
Primary sequence features predict CRX occupancy in vivo. (A) Schematic of analytical approach. We selected 5250 CRX-bound regions and 52,500 CRX-unbound regions based on CRX ChIP-seq data (200-bp elements centered on peak summits). Feature vectors composed of average dinucleotide frequencies and/or counts of specific TF binding sites (up to 206) were defined for each sequence. (B) CRX ChIP-seq peaks are centered on local enrichments of specific dinucleotide classes, including elevated GC and AG dinucleotide content. CRX-unbound regions are also modestly enriched for specific dinucleotide classes, likely due to selecting regions with GC content matching that of CRX-bound regions. (C) CRX ChIP-seq peaks are centered on local enrichments of specific TF binding sites, including monomeric and dimeric CRX binding sites. (D) Performance of specific models classifying CRX-bound versus CRX-unbound sequences visualized with ROC (FPR vs. TPR) and PR (recall vs. precision) curves. (TPR) True-positive rate; (FPR) false-positive rate; (dashed lines) performance of random classifiers; (LR) logistic regression. LR: Best PWM indicates counts of dimeric CRX binding sites (single PWM; AUC-ROC = 0.77, AUC-PR = 0.26). LR: Full model indicates dinucleotide frequencies and counts of 206 TF binding sites (binned by PWM score; AUC-ROC = 0.95, AUC-PR = 0.74). For feature weights, see Supplemental Table 2. gkm-SVM indicates 11-mers with seven informative positions (AUC-ROC = 0.99, AUC-PR = 0.92). (E) Performance of LR: full model with features extracted from windows of different sizes (20 bp to 200 bp). Gray box indicates maximum AUC.


