
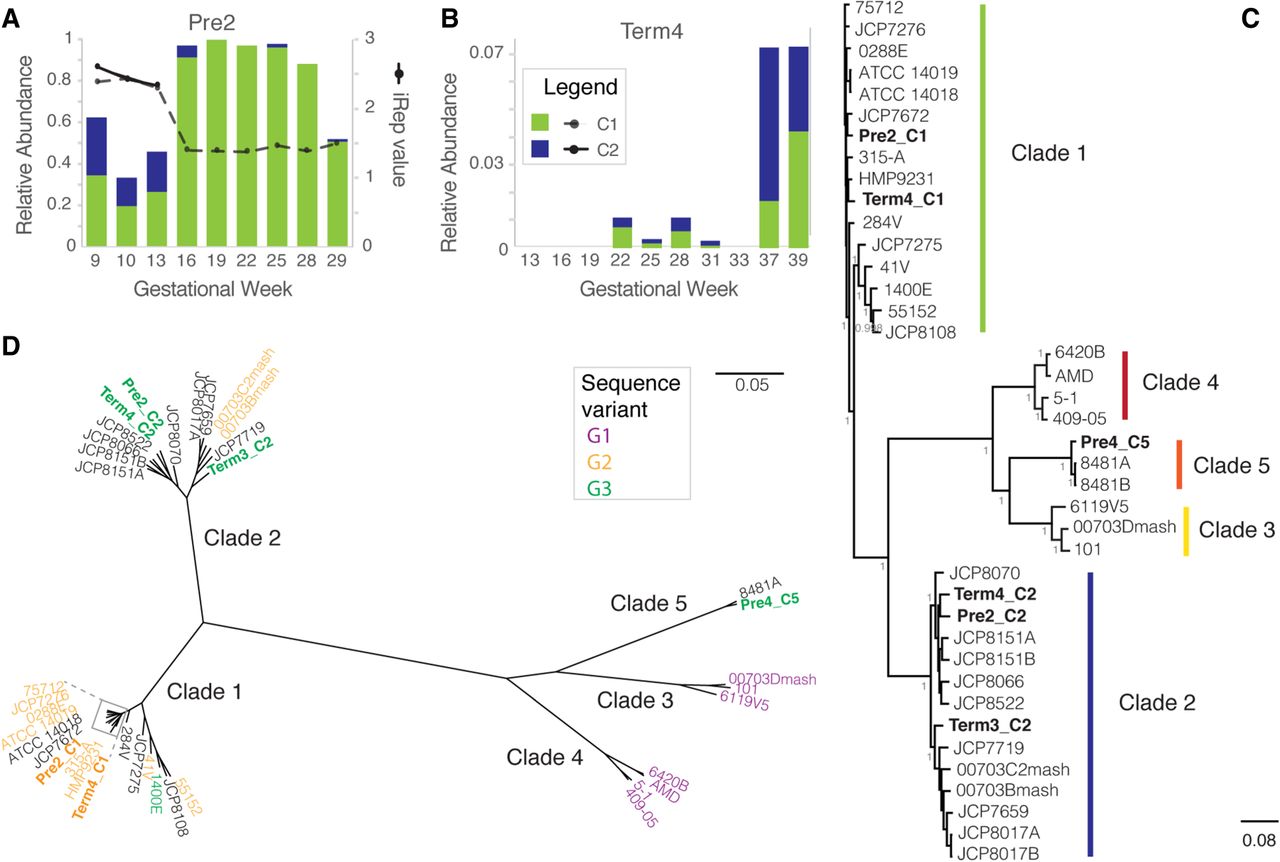
Gardnerella vaginalis genome analysis. 16S rRNA gene abundance of G. vaginalis strains recovered from each of two subjects, Pre2 (A) and Term4 (B). G. vaginalis genotypic groups, C1 and C2, are colored according to the classification in C. Relative abundance (left y-axis). Estimated iRep values are plotted for G. vaginalis strains in subject Pre2 (right y-axis). (C) Phylogenomic tree of 40 G. vaginalis strains genomes, including 34 available in GenBank. The six genomes recovered in the current study are shown in bold. Colored bars represent genotypic groups within the G. vaginalis phylogeny, where colors for clades 1–4 match the G. vaginalis genotypic groups defined by Ahmed et al. (2012). FastTree branch support for the most visible nodes is shown. (D) Radial representation of the same phylogenomic tree displayed in C, where leaves are colored based on 16S rRNA V4 sequence variant classification defined by Callahan et al. (2017). Genomes for which a full-length 16S rRNA sequence or V4 sequence were not available are shown in black.


