
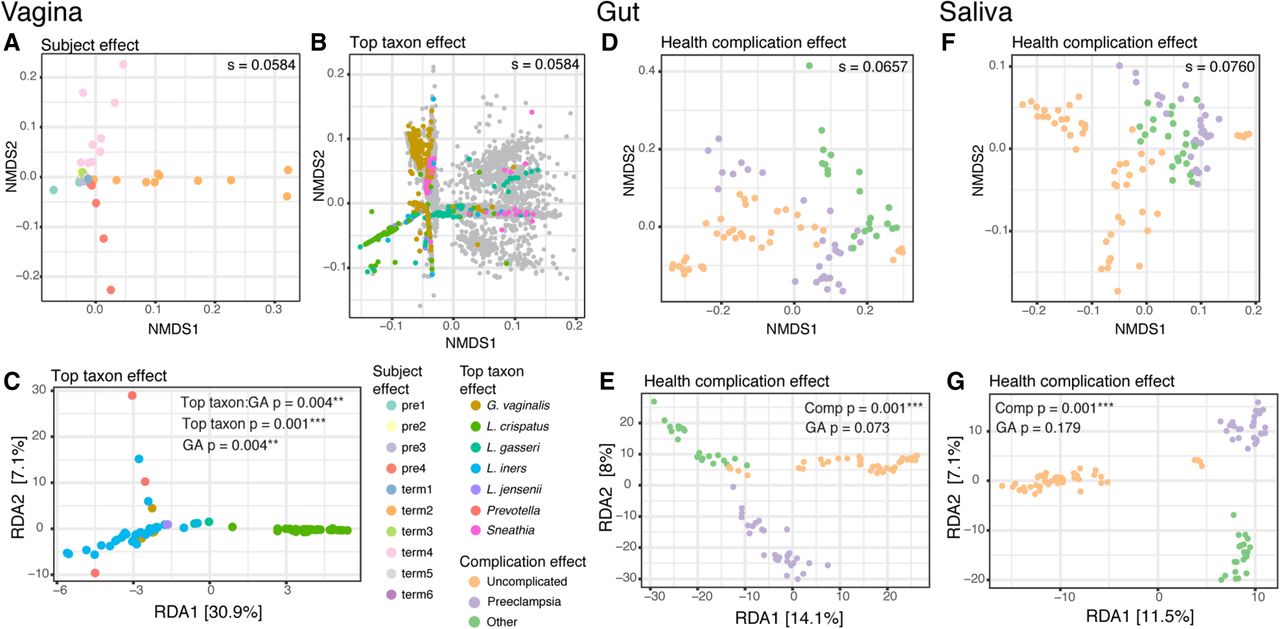
Sources of variation in abundance of UniRef90 gene families across all subjects and samples. Top: (A,B,D,F) Nonmetric multidimensional scaling (NMDS) plots from Bray-Curtis distance matrices of variance-stabilized gene family abundances. The stress, “s” (the amount of variability unexplained by the NMDS ordination), is shown on each plot. Bottom: (C,E,G) Redundancy analysis (RDA) plots from variance-stabilized gene family abundances. The P-values for the RDA plots were estimated with the anova.cca function from the vegan package in R. (A,B) NMDS split plot from vaginal samples: The “samples” plot (A) was color-coded based on subject, whereas the “genes” plot (B) was color-coded based on the taxonomic classification of genes (gray dots: genes belonging to other taxa). (C) RDA plot from vaginal samples, constrained by gestational age (GA) in weeks and by the most abundant taxon in each sample. Samples are color-coded based on the most abundant taxon. (D,E) NMDS and RDA plots from gut samples. (F,G) NMDS and RDA plots from saliva samples. Gestational age and health complication were used to constrain the RDA analysis in E and G. Complication: uncomplicated (five subjects); preeclampsia (three subjects); other, i.e., type 2 diabetes (one subject); and oligohydramnios (one subject).


