
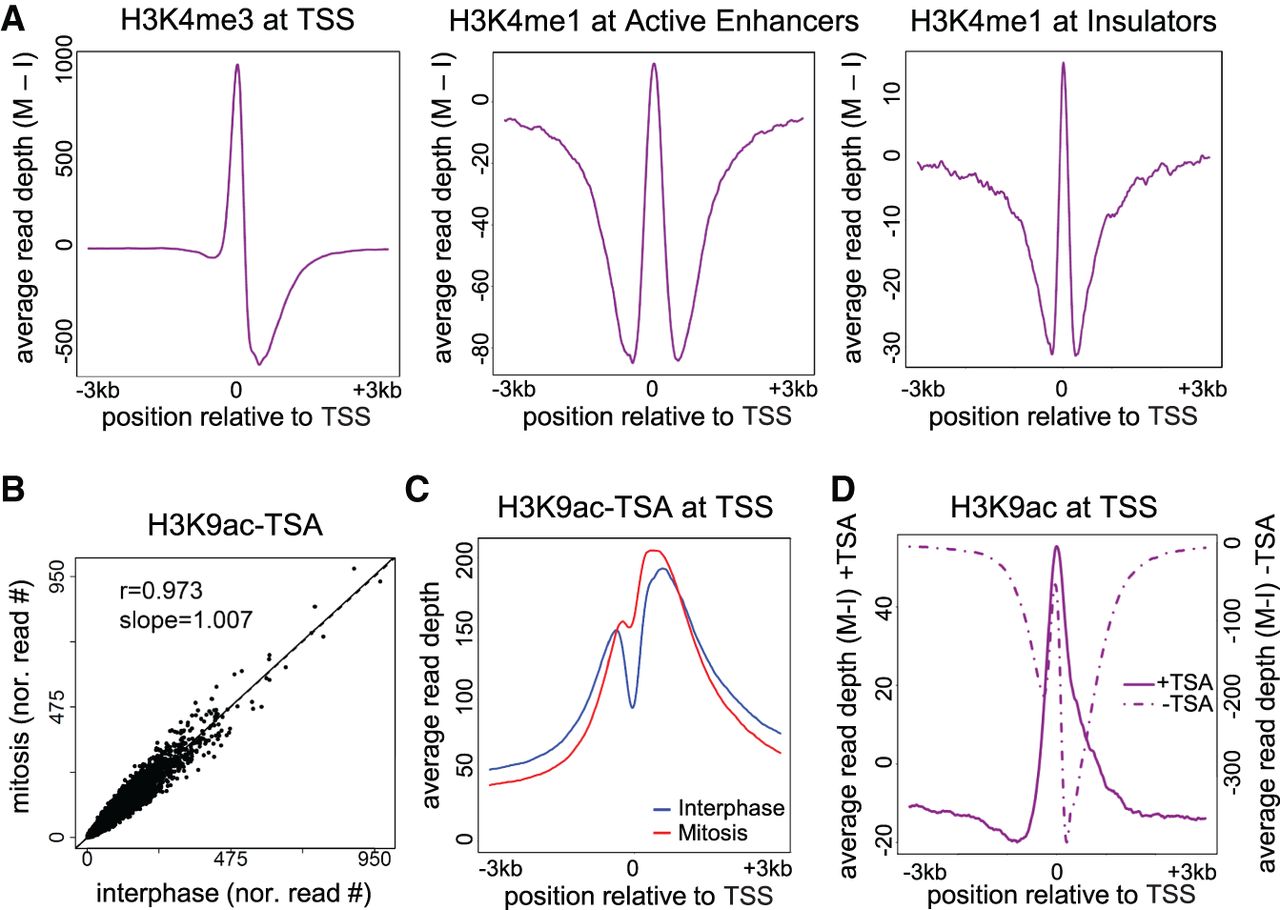
Figure 6.
Nucleosome shifting and deacetylation may explain NDR disappearance. (A) Delta metagene plots (see Methods for details) showing the average read depth of the indicated modifications after subtracting the interphase depths from the mitotic depths. (B) A scatter plot showing the normalized read counts at H3K9ac peaks on cells treated with TSA in mitosis versus interphase. (C) Metagene plot for H3K9ac data after TSA treatment. (D) Delta metagene plot for H3K9ac data before (dotted line) and after (solid line) TSA treatment. Similar results were obtained in a biological replicate (Supplemental Fig. S14).


