
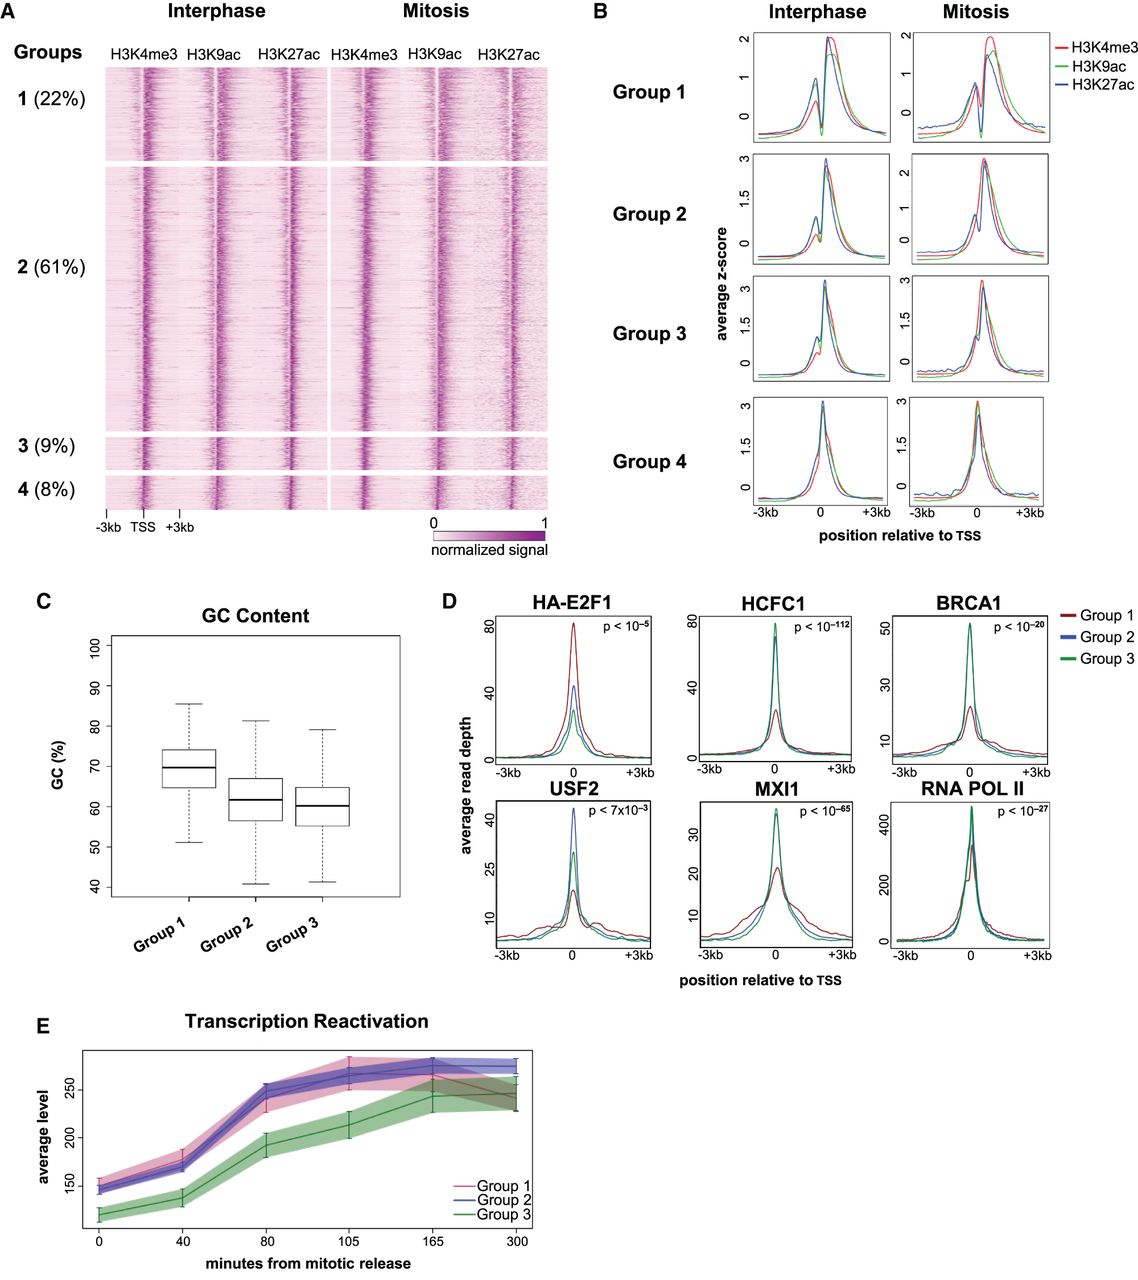
Characterization of the TSS-associated NDRs. (A) A heat map showing the normalized and standardized z-scores at 6-kb regions centered at the TSS of 5731 genes that are occupied by H3K4me3, H3K9ac, and H3K27ac. The regions were manually divided into four groups (Groups 1–4) after visual inspection; the percentage of regions in each group is shown in parentheses. (B) Metagene plots showing the average occupancy of each modification for the four groups. (C) Boxplot showing the difference in the GC content at the TSS for Groups 1–3. The difference between Group 1 and each of the other groups (Group 2 and Group 3) is highly significant (P-value = 1.67 × 10−133 and 3.97 × 10−84; t-test, and effect size = 0.88 for Group 2 and 1.12 for Group 3). (D) Metagene plots showing ENCODE ChIP-seq data and our RNA PolII data for Groups 1–3; P-values were obtained either by comparing Group 1 to the combination of Groups 2 and 3 (for HCFC1, BRCA1, MXI1, and RNA PolII), or by determining the maximal P-value from all pairwise comparisons (for HA-E2F1 and USF1). For a comprehensive list of all P-values, see Supplemental Table S2. The same analysis for all available ENCODE HeLa-S3 data is shown in Supplemental Figures S11, S12. (E) Profiles showing transcription reactivation kinetics following release from mitosis. The difference between Groups 1 and 2 versus Group 3 is significant (P-value = 0.00235; ANOVA. Note: This tests the change over time of the transcription levels and is therefore not sensitive to the difference in initial level [time = 0] between the groups).


