
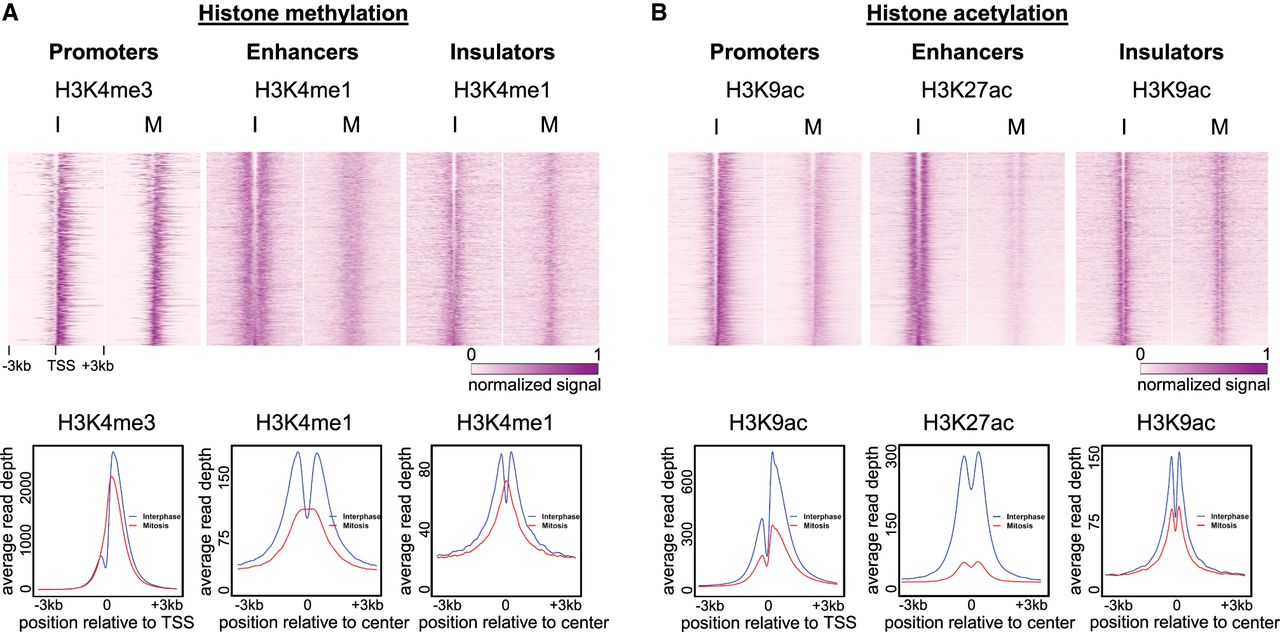
Figure 4.
The nucleosome that enters the NDR during mitosis is distinguishable from the surrounding nucleosomes. Top: Heat maps showing the normalized and standardized read depth at 6-kb regions centered at either TSSs, enhancers, or insulators, for H3K4 methylation (n = 6488, 7062, 4367, respectively) (A), and H3K9 or H3K27 acetylation (n = 6808, 5565, 3033, respectively) (B). Bottom: Metagene plots showing the average read depth for all regions in each category are under the relevant heat map. Similar plots for additional modifications as well as a biological repeat are shown in Supplemental Figures S5–S7.


