
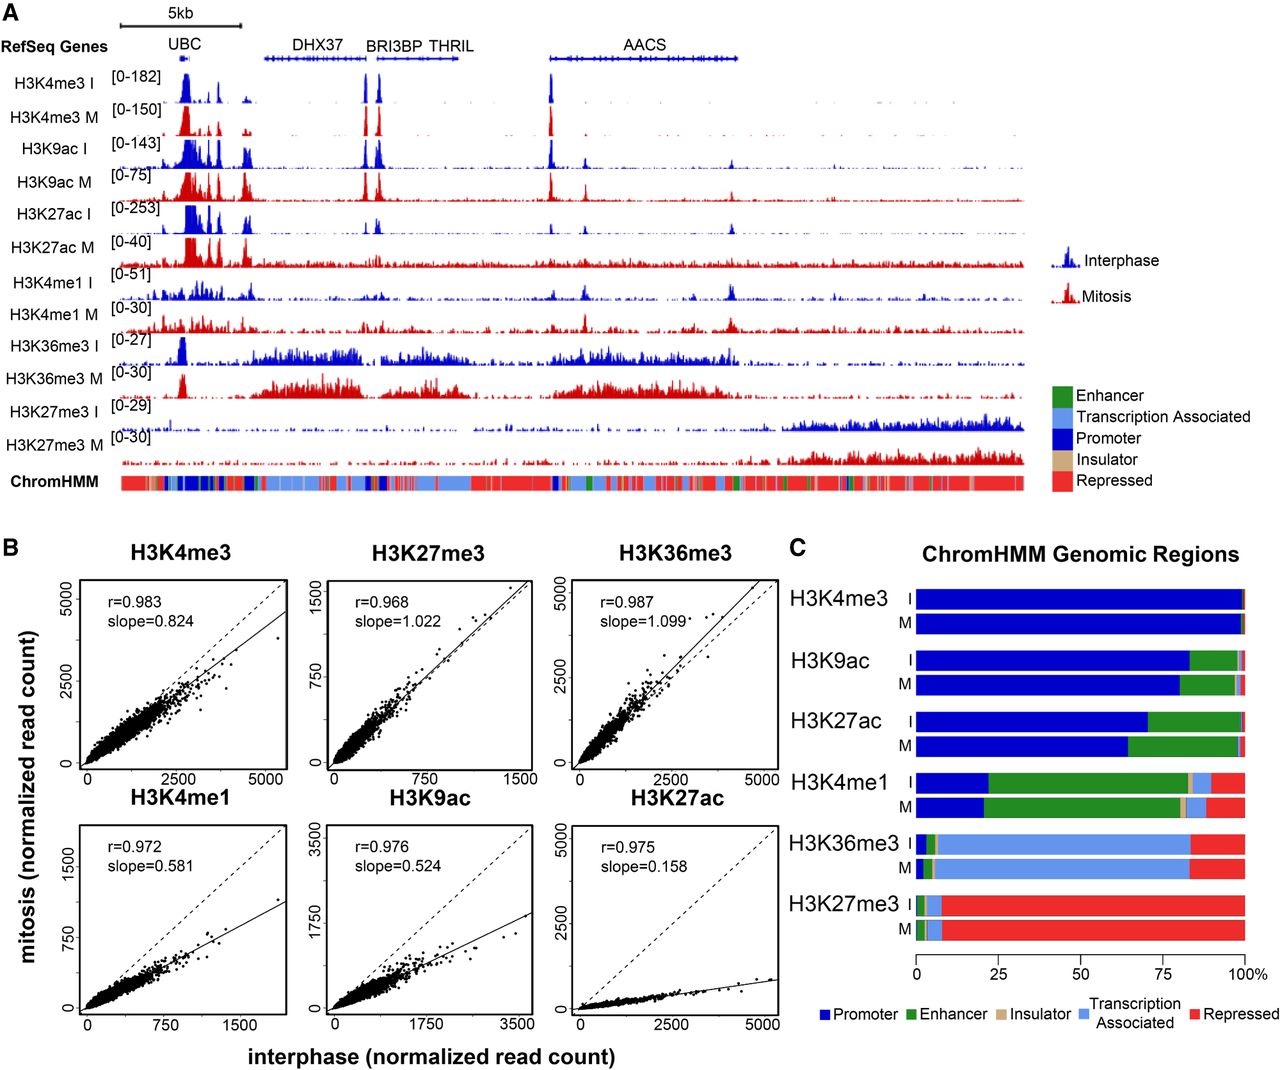
High concordance between mitotic and interphase histone modification patterns. (A) Integrative Genomics Viewer (Robinson et al. 2011; Thorvaldsdottir et al. 2013) tracks showing the alignments for the indicated histone modification ChIP-seq results for interphase (blue) and mitosis (red) samples on an ∼315-kb region on Chromosome 12. The scale of each track was adjusted to the total number of reads using the Normalize Coverage Data option in IGV (see Methods). The ChromHMM annotation for each genomic region is shown below the plot using the same color code as in C. (B) Scatter plots showing the normalized read counts for all regions enriched in each modification (see Methods for more details) in mitosis versus interphase. It should be noted that ChIP-seq-based quantification may be less accurate than quantification based on mass spectrometry data due to inherent noise in the ChIP-seq method. Thus, in cases of a discrepancy, e.g., H3K4me1, we rely on the mass spectrometry results for quantification, and on the ChIP-seq results for localization. (C) Bar plots showing the percentage of reads in peak regions per ChromHMM category.


