
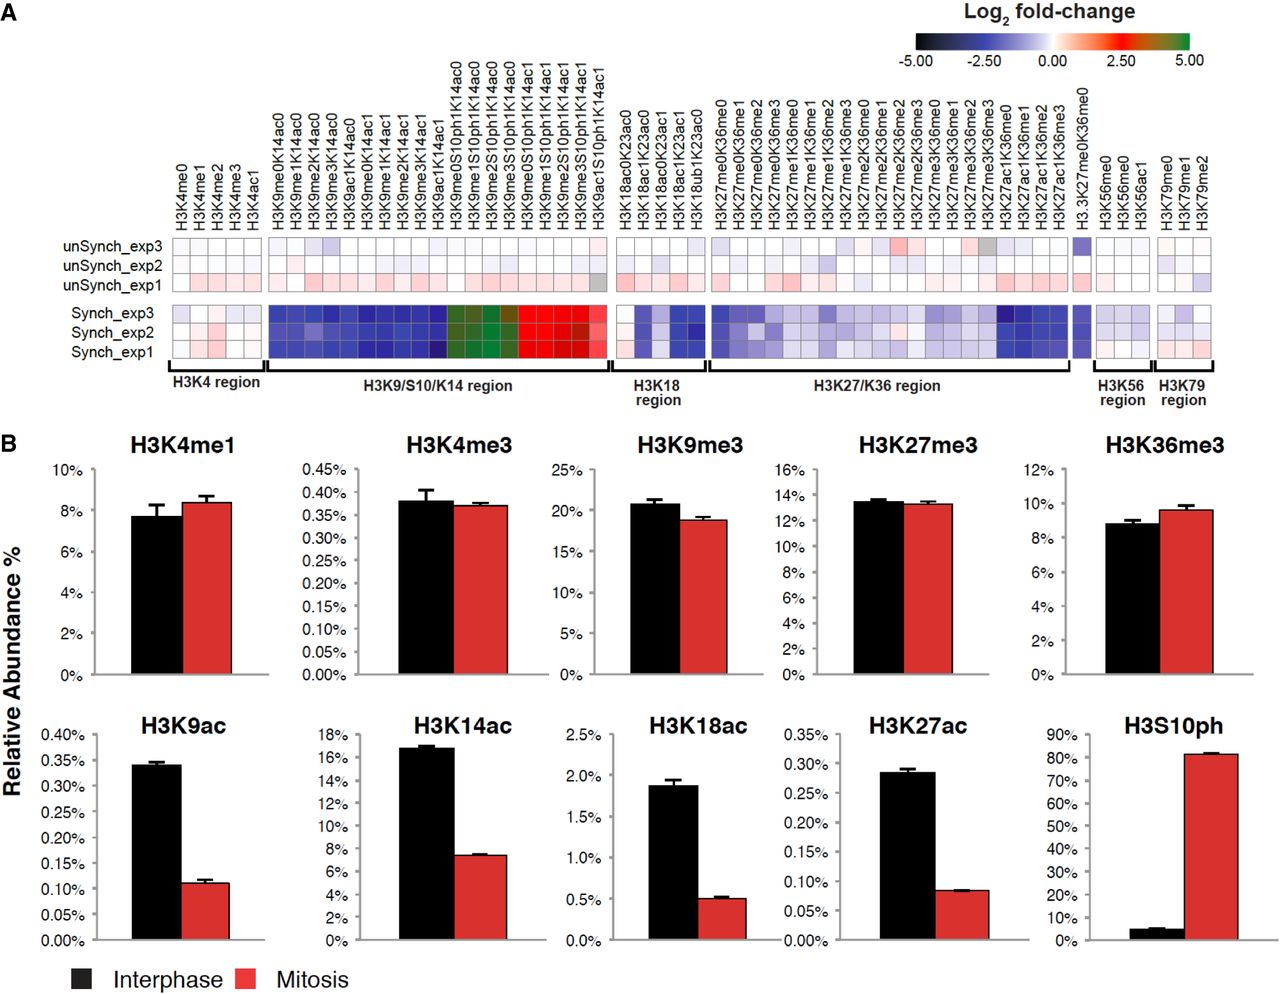
Identification of global changes in histone H3 modifications by quantitative targeted mass spectrometry analysis. (A) Heat map (log2 of fold change) of the different histone modifications as detailed on top. “Regions” (all peptides associated with specific modified/unmodified residue/s) are shown at the bottom. The peptides from these regions were then used to calculate the occupancy percentage of each specific histone modification presented in B. Data were normalized to the average signal of interphase samples. (B) Relative abundance of selected modifications on H3 tails from interphase or mitotic HeLa-S3 cells. The data were obtained by quantitative targeted mass spectrometry analysis. Each bar represents the percentage of the H3 peptides with the indicated modifications within the total H3 tail peptide population. Note the high levels of the mitosis unique modification, H3S10ph (∼17-fold increase, P-value < 10−3; two sided t-test), which provides evidence supporting the tight synchronization of the mitotic samples. Similar results were obtained for H4 modifications (Supplemental Fig. S2). Also note the general decrease in the level of all forms of the K27/K36 peptide in mitosis. This is most probably a result of the mitosis-associated phosphorylation of serine 28 (S28), which is located on the same peptide, reducing the abundance of the nonphosphorylated forms of this peptide in mitosis. We did not include the S28 phosphorylation in our analysis due to lack of an appropriate standard peptide. Yet, we can still infer the presence of the H3S28ph modification, and as detailed in the Supplemental Note, we do not expect the reduced confidence we have in detecting H3S28ph to impact our estimates of the total population measurements of H3.


