
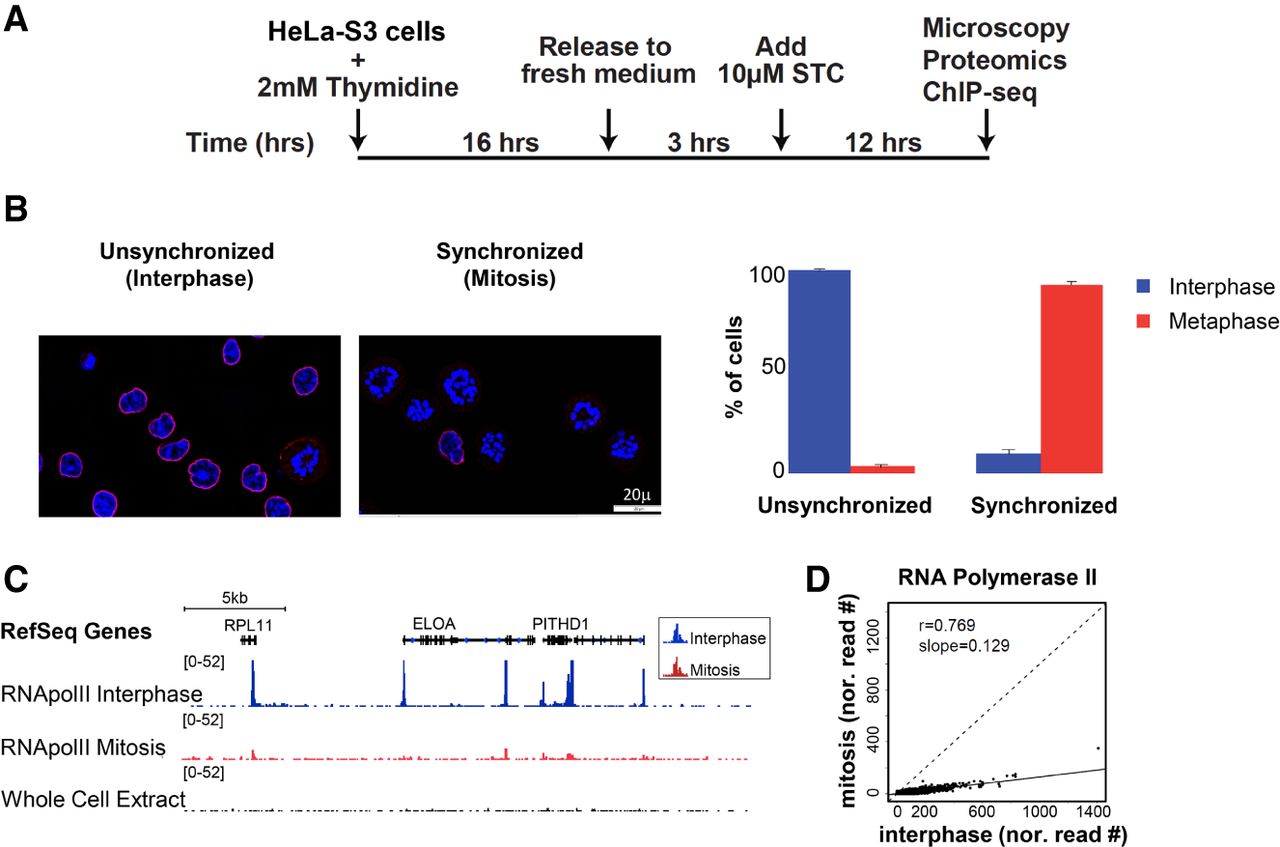
Efficient metaphase synchronization of HeLa-S3 cells using a kinesin 5 inhibitor (STC) reveals low levels of RNA PolII binding during metaphase. (A) Schematic representation of the synchronization approach. (B) Synchronization was monitored by microscopy using both DAPI (blue) and Lamin B (red) staining. Only cells with the monopolar spindle appearance of the chromosomes and that lack a nuclear envelope were counted as cells in the metaphase stage. The percentage of cells in interphase (blue) and metaphase (red) are shown for both conditions, along with the standard error (SE). For simplicity, we refer to the unsynchronized population as “interphase” and to the synchronized one as “mitosis.” (C) Integrative Genomics Viewer (IGV) (Robinson et al. 2011; Thorvaldsdottir et al. 2013) tracks showing the alignment for RNA PolII ChIP-seq results on an ∼180-kb region on Chromosome 1. The image demonstrates reduced levels of RNA PolII binding in the metaphase sample (red) compared to the interphase sample (blue). (D) A scatter plot showing the normalized read counts at RNA PolII peaks (see Methods for more details) in mitosis versus interphase.


