
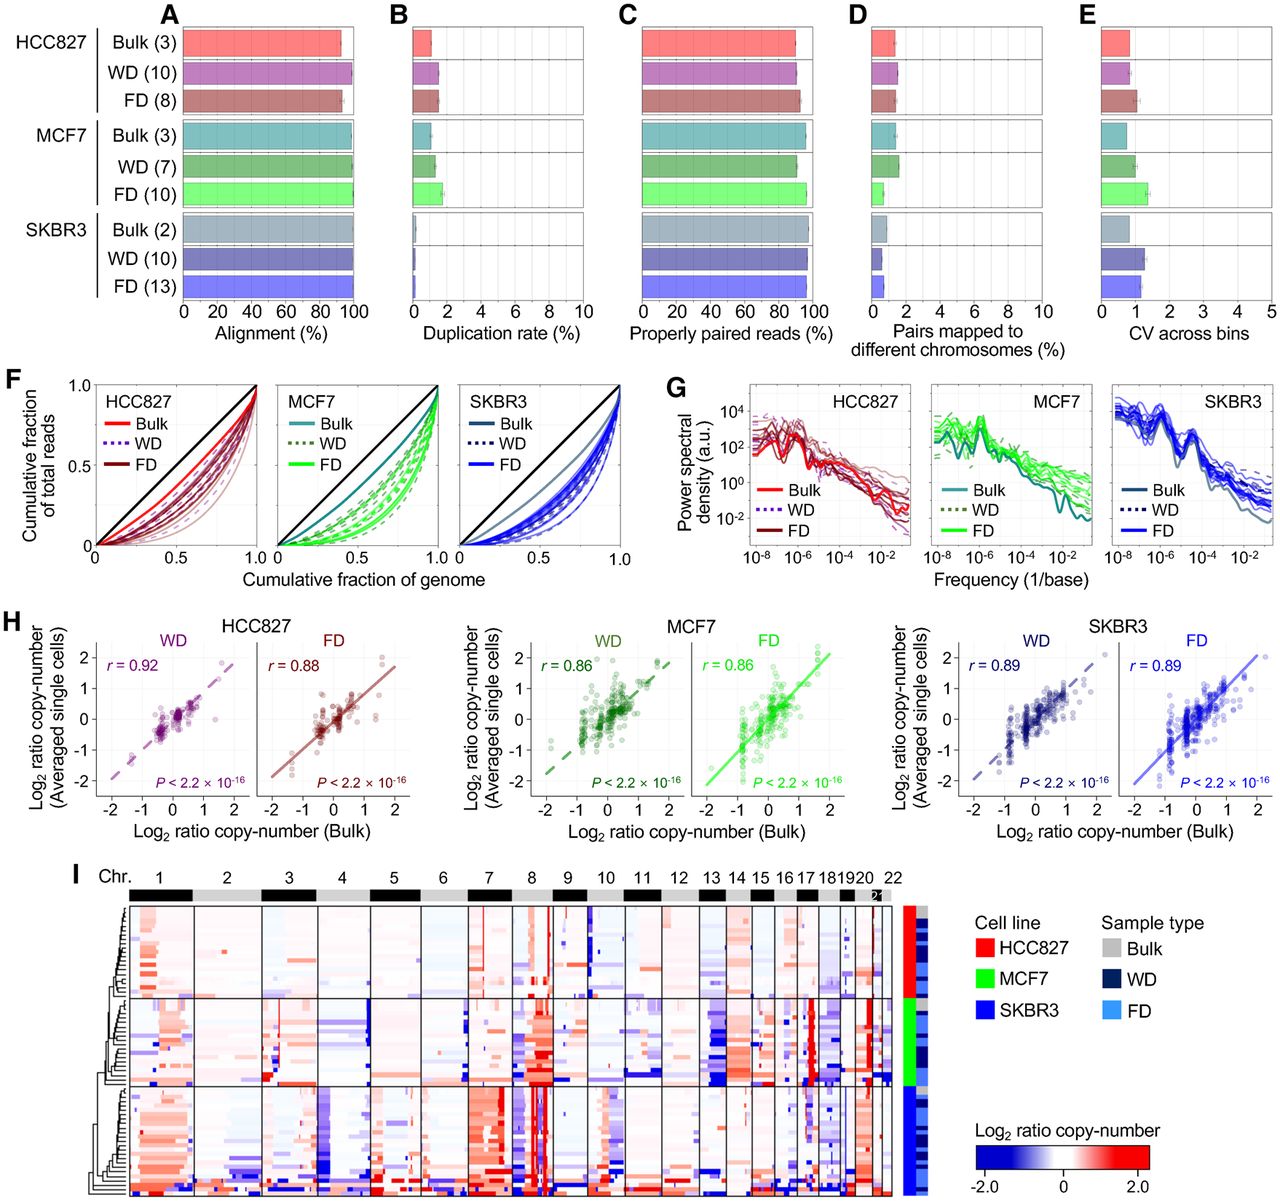
Evaluation of single-cell WGA performance using SIDR-seq. (A–D) Summary of sequencing metrics. The number of samples is indicated in parentheses. The plots display fractions of sequencing reads properly aligned to the human reference genome (A), duplicated (B), properly paired (C), and with their paired reads mapped to different chromosomes (D). (E) Bin-to-bin variability in genomic DNA read counts. (F) Lorenz curves illustrating the relationship between the cumulative fractions of the genome covered (x-axis) and those of mapped bases (y-axis). The diagonal black lines indicate theoretical perfect uniformity. (G) Power spectrum of read distributions over different genomic length scales. (H) Correlations of copy numbers between bulk cells and averaged single cells. Pearson's correlation coefficients (r) with their statistical significances (P) are shown. (I) Unsupervised clustering heatmap of genome-wide copy-number profiles in bulk and single cells from HCC827, MCF7, and SKBR3 cells. The dendrogram was generated based on the Euclidean distance metric with Ward's method (Ward 1963). (FD) DNA fractionated from single cells by SIDR; (WD) genomic DNA from the whole-cell lysates of single cells.


