
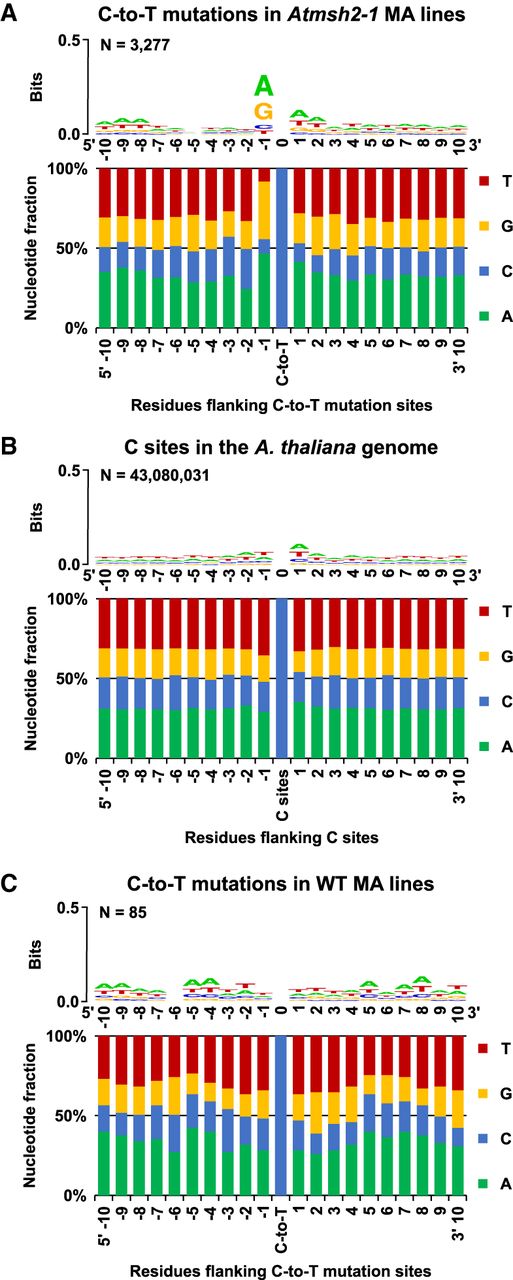
Flanking sequence bias at SNV sites in MMR-deficient A. thaliana. Nucleotide flanking sequences 10 bases upstream (5′) and downstream (3′) from each mutated site are shown as stacked columns and sequence logos (Schneider and Stephens 1990; Crooks et al. 2004). (A) Combined 1470 C-to-T and 1807 reverse complemented G-to-A to C-to-T mutations in G5 Atmsh2-1 MA line samples. (B) The haploid flanking sequence composition for all C and reverse complemented G sites in the TAIR10 A. thaliana reference genome. (C) The combined flanking sequences at sites of spontaneous C-to-T and reverse complemented G-to-A to C-to-T transition site mutations identified in WT (MMR-proficient) A. thaliana MA lines (Ossowski et al. 2010; Jiang et al. 2014). Sequence logos showing graphical representations of the relative frequencies of individual nucleotide residues with respect to position within the flanking sequences are shown as stacked letters, along with the number of sites (combined C and reverse complemented G-to-A to C-to-T sites) considered (shown as N). The letters in each stack are ordered from most (top) to least (bottom) frequent. The overall height of each stack indicates the sequence conservation at that position (measured in bits), whereas the height of each letter within the stack indicates the relative frequency of each nucleotide (A, T, C, or G) at that position (Crooks et al. 2004).


