
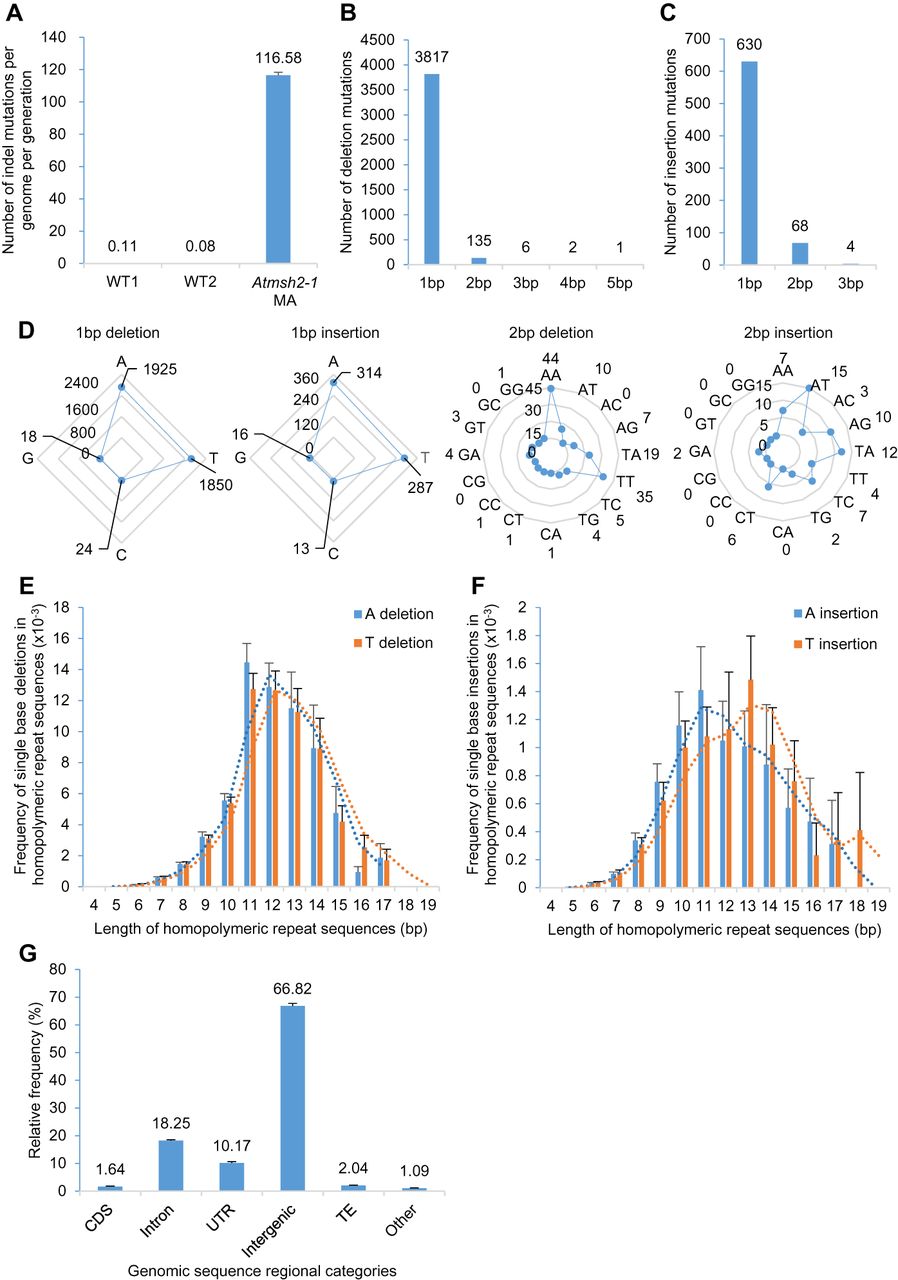
Characterization of indel mutations in MMR-deficient A. thaliana. (A) Frequency of indels (insertions and deletions) in G5 Atmsh2-1 MA line samples compared with that in wild-type (WT) controls (WT1 data from Ossowski et al. 2010; WT2 data from Jiang et al. 2014). Error bars indicate SEM (too small to be clearly visible in WT1 and WT2). (B,C) Length distributions (in bps) of indels in G5 Atmsh2-1 MA line samples: (B) deletions; (C) insertions. (D) Comparison of different classes of 1- and 2-bp indels accumulated in G5 Atmsh2-1 MA line samples. (E,F) Frequency of single-base A or T deletions (E) or A or T insertions (F) in different length categories of homopolymeric A or T repeat regions (values normalized by the number of each length category of homopolymeric A or T repeat region in the A. thaliana genome) (Supplemental Fig. 2A,B). Dotted lines indicate moving average trends. (G) Genomic distribution of indels in G5 Atmsh2-1 MA line samples. (CDS) coding sequence; (UTR) untranslated region; (TE) transposable element; (Other) noncoding RNAs and pseudogenes. Error bars in E–G indicate SEM (from eight different Atmsh2-1 MA biological replicates) (Supplemental Table 4).


