
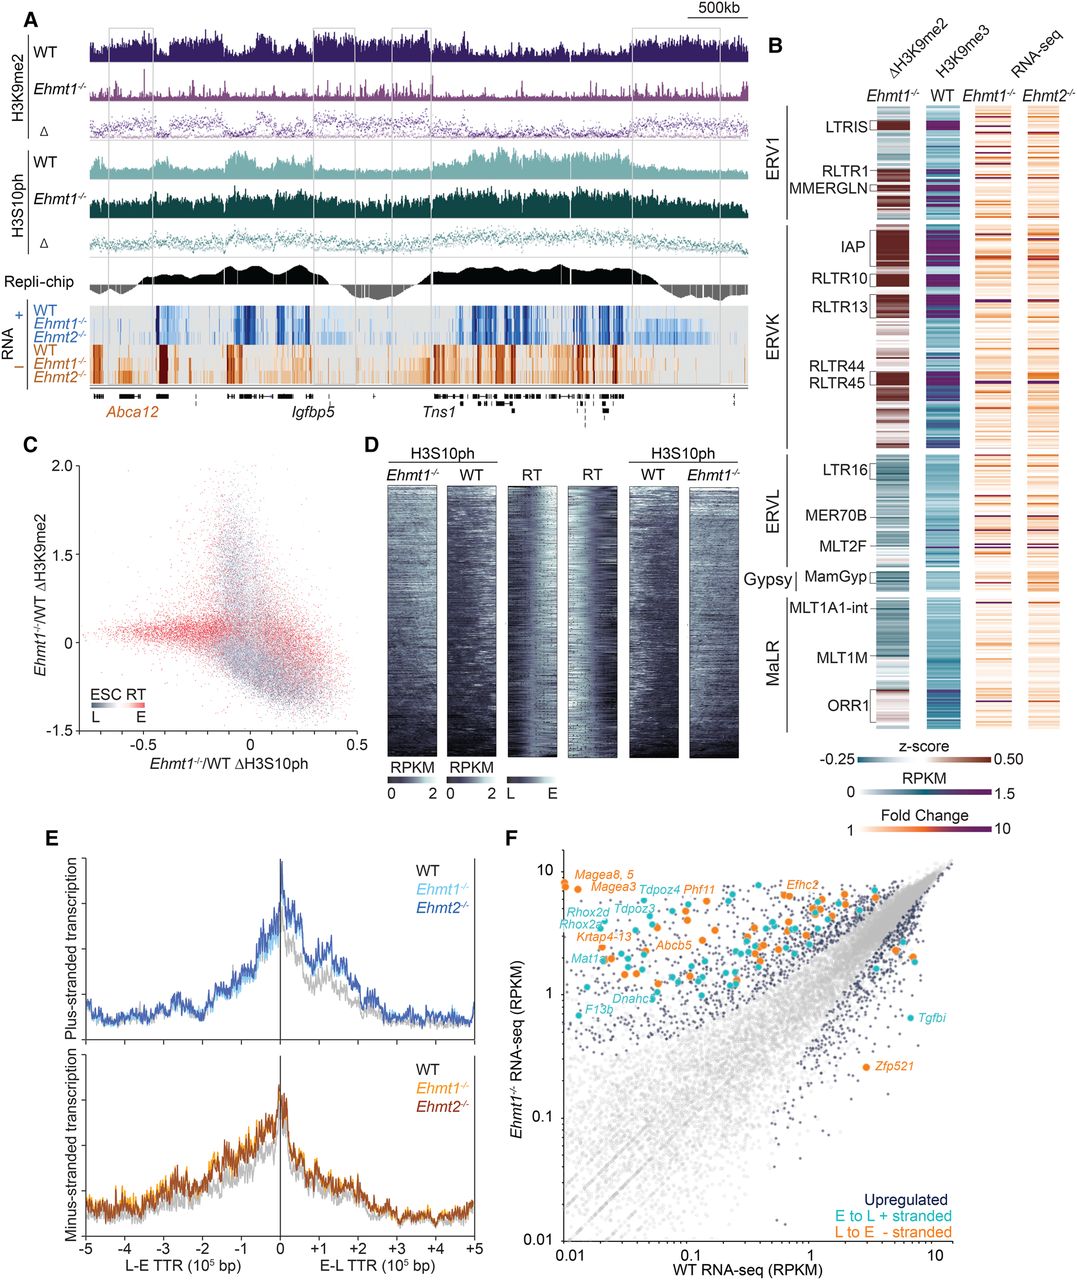
EHMT1 restricts spreading of H3S10ph and inhibits aberrant transcription near TTRs. (A) Genome browser screenshot of a region on Chromosome 1 showing H3K9me2, Hesp-treated (H+) H3S10ph, and strand-specific RNA-seq in WT and Ehmt1−/− ESCs. (B) Heat maps of the change in H3K9me2 enrichment in Ehmt1−/− vs. WT (z-score), H3K9me3 enrichment (RPKM) in WT, and differential expression in Ehmt1−/− vs. WT ESCs for all LTR transposable element subfamilies present at >100 copies in the reference mouse genome. (C) Scatterplot showing the changes in H3K9me2 and H3S10ph coverage in Hesp-treated Ehmt1−/− ESCs relative to WT, overlaid with ESC RT status of the genomic bins as a heat map (red: early; gray: late). In Ehmt1−/− ESCs, late-replicating regions concurrently lose H3K9me2 and gain H3S10ph. (D) Heat map of H3S10ph enrichment in Hesp-treated WT and Ehmt1−/− ESCs over 500 kb centered on all RT transition boundaries in WT ESCs (RT data from Yokochi et al. [2009]). (E) Cumulative density plot of RNA-seq coverage on the plus (top plot) and minus (bottom plot) strands at TTR boundaries (0–500 kb) in WT, Ehmt1−/−, and Ehmt2−/− ESCs. Note the increase in RNA coverage in the mutant lines on the plus strand in early to late transition regions and the minus strand in late to early transition regions. (F) 2D scatterplot comparing genic transcription in Ehmt1−/− and WT ESCs. Note that many of the genes up-regulated in Ehmt1−/− ESCs reside within RT transition boundaries (0–500 kb) and show a RT orientation strand-bias consistent with that described in E.


