
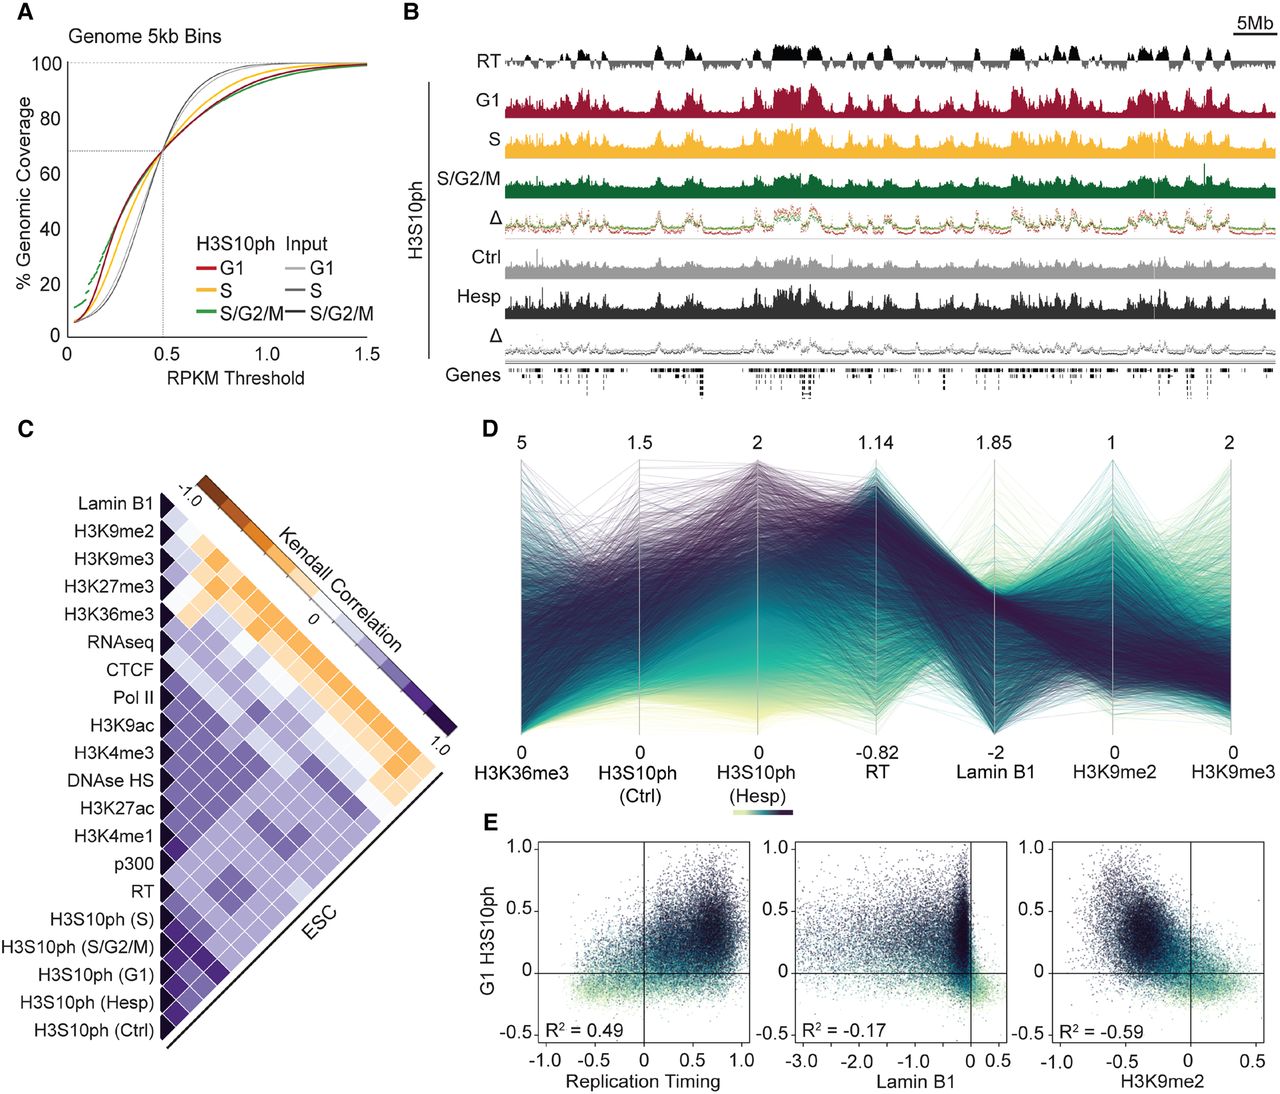
Interphase H3S10ph forms domains highly concordant with replication timing. (A) Cumulative distribution frequency plot of ESC H3S10ph ChIP vs. input libraries in 5-kb bins. (B) Genome browser screenshot of H3S10ph enrichment and replication timing (RT) (Hiratani et al. 2010) in TT2 ESCs across Chr 18. (C) Kendall correlation matrix of H3S10ph with chromatin features (see Supplemental Table S2 for data sets analyzed) across 5-kb genomic bins in ESCs, following unsupervised hierarchical clustering. H3S10ph ESC data sets include sorted FUCCI subpopulations (S, S/G2/M, and G1), Hesp-treated, and vehicle control (Ctrl). (D) Parallel coordinate comparison of H3S10ph enrichment (RPKM) with histone marks H3K36me3, H3K9me2, and H3K9me3 as well as Lamin B1 and RT in randomly sampled 5-kb bins. Heat map color-coding is based on H3S10ph enrichment in Hesp-treated ESCs. Note the strong positive correlation between H3S10ph in interphase and RT and the negative correlation with H3K9me2. (E) Pair-wise comparisons of G1 H3S10ph enrichment with RT, LADs, and H3K9me2 (input subtracted RPKM) enrichment. Randomly sampled 5-kb bins are colored as in D. R2 = Pearson's correlation.


