
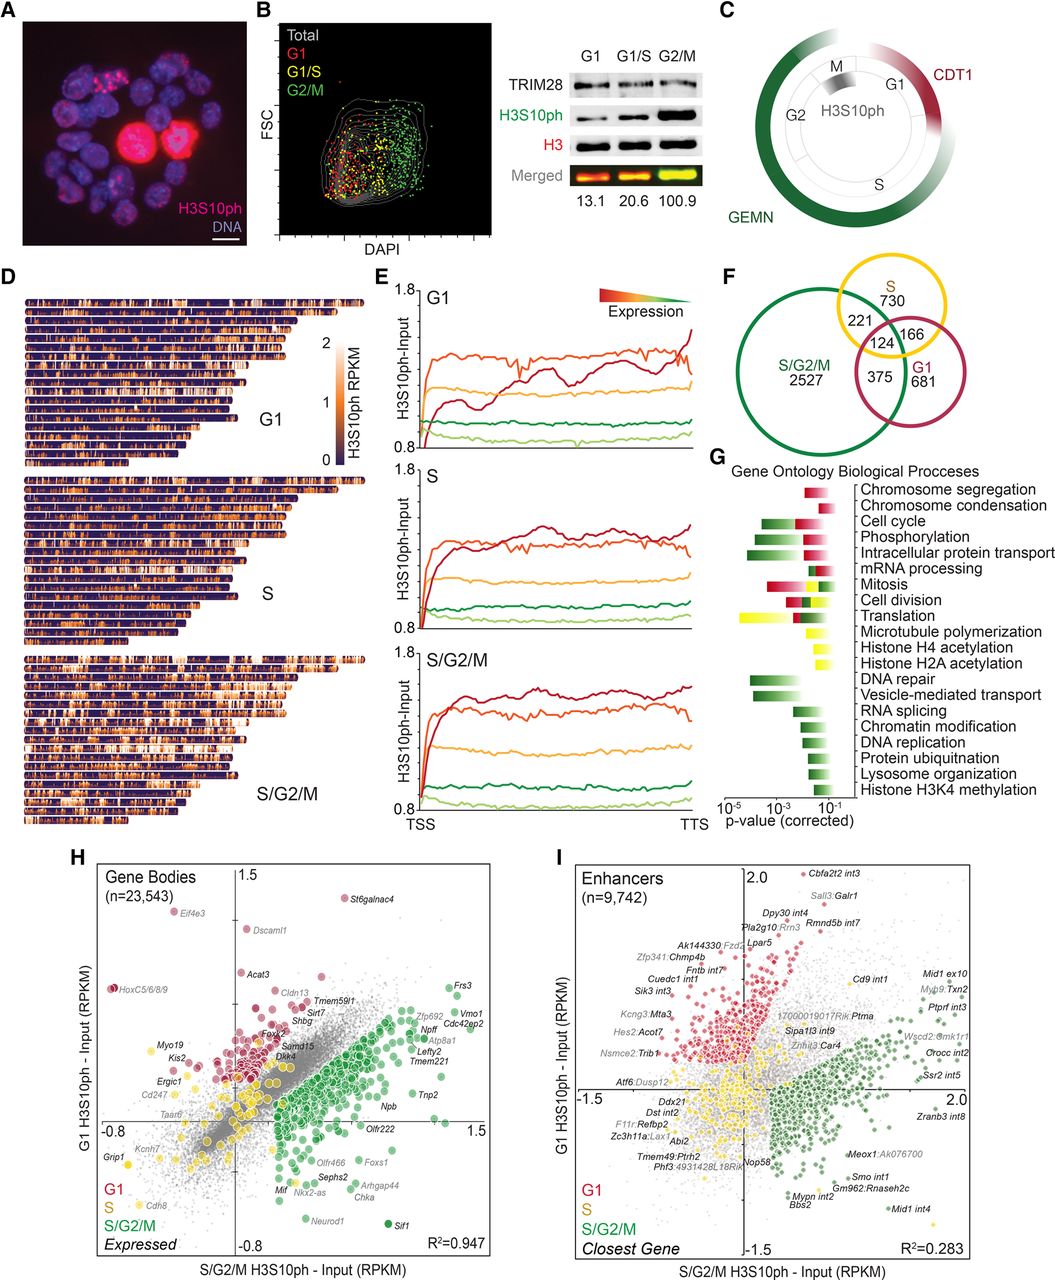
Genome-wide characterization of cell cycle-specific H3S10ph. (A) H3S10ph immunostaining of asynchronous WT TT2 ESCs, counterstained with Hoechst 33342. Scale bar, 10 µm. (B) G1, G1/S, and G2/M ESCs were isolated by FACS based on DNA content (DAPI-staining) and a flow cytometry plot showing the merge of each post-sort purity analysis is shown. Western analysis of whole-cell extract was conducted using H3S10ph- and H3-specific antibodies, and H3S10ph levels were quantified on the Odyssey infrared imager by normalizing to H3 fluorescence level. The percentage of H3S10ph/H3 is shown for each extract. TRIM28 served as a second loading control. (C) Schematic of the FUCCI reporter system for dissection of cell cycle-specific H3S10ph. CDT1-mKO and GEMN-Venus are fluorescent markers of G1 and S/G2/M, respectively. (D) Heat map depicting H3S10ph enrichment across all murine autosomes in G1, S, and S/G2/M sorted fractions. (E) Metagene analysis of normalized H3S10ph enrichment in ESCs (input-subtracted reads per kb mapped [RPKM]) over all ENSEMBL annotated gene bodies, clustered by expression levels in quintiles. (F) Venn diagram of genes enriched for H3S10ph (greater than twofold over input in gene bodies) in G1, S, and S/G2/M sorted fractions. (G) Gene Ontology of Biological Processes from genes identified as in E (Bonferroni corrected P < 0.05). (H) Pair-wise comparison of H3S10ph enrichment (input-subtracted RPKM) over all gene bodies in G1 vs. S/G2/M sorted fractions. Colored dots represent genes with cell cycle skewing (z > 0.5). R2 = Pearson correlation. (I) Pair-wise comparison of H3S10ph enrichment (input-subtracted RPKM) over annotated enhancer regions in G1 vs. S/G2/M sorted fractions. Colored dots represent sites with cell cycle skewing as in G. A subset of enhancers is labeled with the overlapping gene(s), exon (ex), intron (int), or flanking gene(s) with the closest gene in black.


