
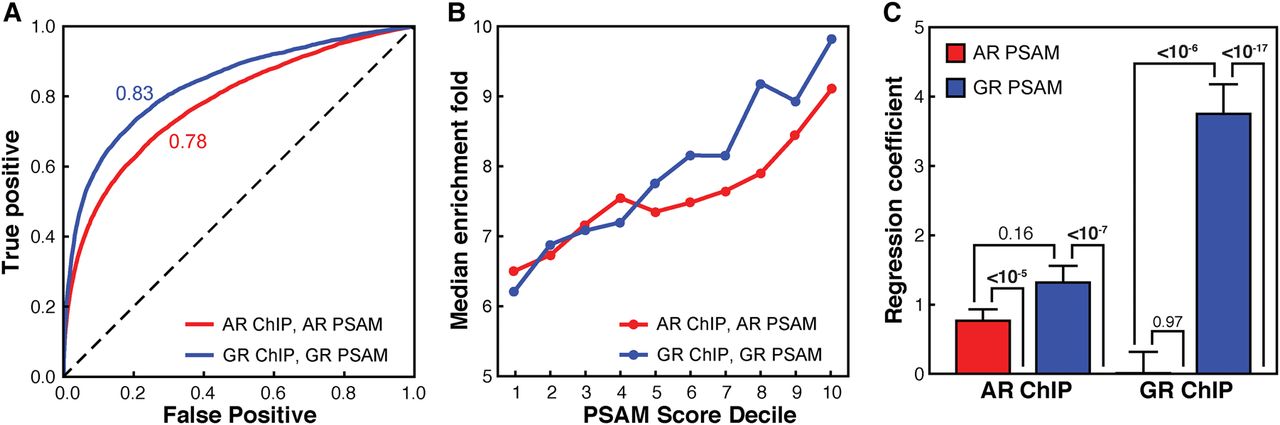
Differences of intrinsic specificity between AR- and GR-DBD are reflected in the respective cellular genomic binding profiles. (A) Ability of the AR (red) and GR (blue) PSAMs to identify true ChIP-seq peaks as measured by the receiver operator characteristic (ROC) of binary classifiers identifying peaks versus adjacent regions. (B) Comparison of the median enrichment over background from ChIP-seq (y-axis) to the relative affinity for the strongest sequences within the ChIP-seq peak calculated from the position specific affinity matrix for AR (red) and GR (blue). In vitro affinity is binned by decile (e.g., 10 is the sequence space representing the top 10% highest affinity sites) (C) Multiple linear regression coefficients in models that use AR (red) and GR (blue) PSAM scores to predict AR (left) and GR (right) ChIP-seq peak enrichments. P-Values were calculated using t-tests.


