
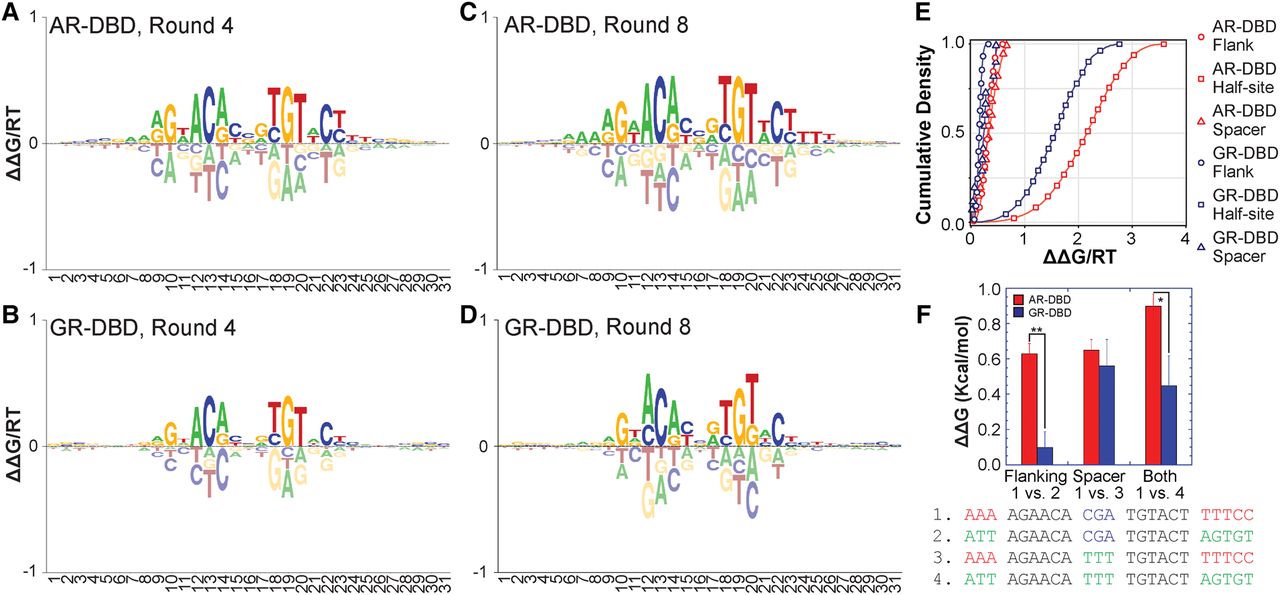
SelexGLM shows differences in DNA recognition between AR and GR throughout their binding sites. (A–D) Energy logos for AR-DBD (top) and GR-DBD (bottom), obtained by fitting biophysical models for protein–DNA interaction to the SELEX read counts using an iterative generalized linear modeling approach based on Poisson regression, implemented as SelexGLM. Highly similar logos were obtained using two separate rounds of data. See Supplemental Figure S5 for logos generated using round 4 to 8 data. (E) Cumulative distribution functions for the contribution of half-site (squares), spacer (triangles), and flanking (circles) sequences on AR-DBD (red) and GR-DBD (blue) binding energy. (F) Validation of the contribution of flanking A tracts and spacer to AR- and GR-DBD binding performed by quantitative electrophoretic mobility shift assay (EMSA). Loss of flanking A tracts is more detrimental to AR- than GR-DBD (one vs. two), whereas changing spacer can have detrimental effects on the binding of both (one vs. three). Error bars, SEM based on at least three repeats of each experiment. (*) P-value ≤0.05, (**) P-value ≤0.01, two-sided t-test.


