
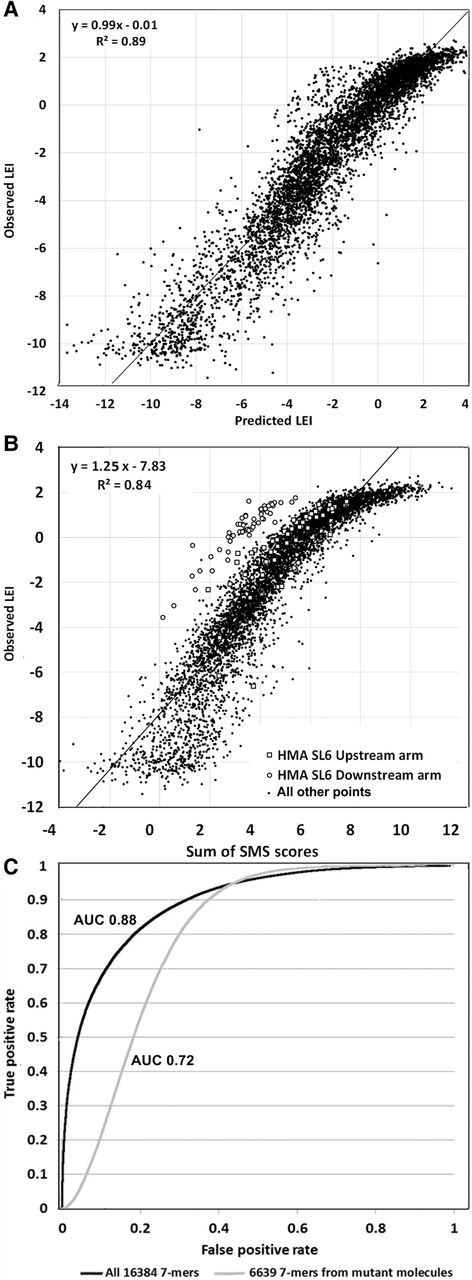
Prediction of splicing efficiency. (A) An equation for multiple linear regression was derived using all splicing data except that of HMD. Eighty significant protein/positions were found and used. The results show the 5004 points (molecules) derived by merging all 10-fold cross-validations. (B) Prediction of splicing in all 5560 mutants based on the sum of exonic SMS scores. Note the strong correlation, the tendency toward saturation at high splicing efficiencies, and the outliers starting in the upstream and downstream stem arms of the functional stem–loop structure in HMA (open squares and circles, respectively). (C) ROC curve for the distinction between ∼100,000 human constitutive exons (average length 136 nt) and ∼100,000 pseudoexons (average length 128 nt). The maximum accuracy (true positives + true negatives)/(total combined sequences) was 0.81 for the experiment in which all 16,384 SMS scores were used.


