
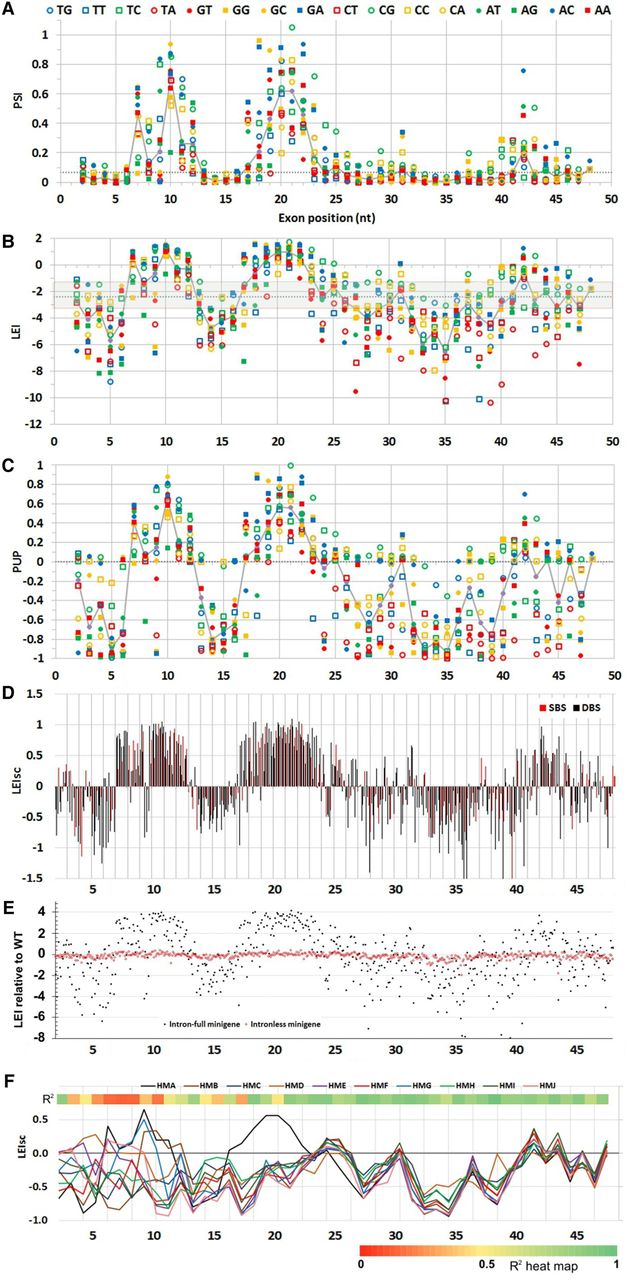
Splicing phenotype maps of HMA. Terms used to express splicing efficiency can be found in Table 2. Different measures were used to quantify splicing: (A) PSI (proportion spliced in) exhibited by each molecule, calculated from EI (see Methods). This linear metric tends to hide the extent of decreases. The dotted gray line here and in B and C indicates the WT phenotype. (B) LEI, the log2 of the EI, displaying a wide range of decreases at the expense of increases. The gray area encompasses changes that are less than twofold. (C) PUP, the proportion of the ultimate phenotype. The WT EI is set to zero and the EI of each mutant is normalized to the maximum change, treating increases and decreases separately and giving equal visual weight to both. In most HMs, the maximum splicing increase was to nearly 100% and the minimum was zero. (D) Landscape view: Each mutant is shown as a column; each starting position is comprised of 12 columns, one for each type of base change. Black columns, DBSs; red, SBSs. (E) Mutagenesis of intronless minigenes (red points). Splicing is expressed as the relative LEI: the log2 of EI/WT EI. Increases in splicing are positive and decreases negative. Black points show the results with intron-containing minigenes for comparison. The other nine HMs yielded similar results (Supplemental Fig. S3). Thus, the vast majority of the mutations analyzed here are affecting splicing. (F) The same mutations produce similar relative phenotypes in the face of potent additional six-base substitutions. The map shows the median of scaled phenotypes (LEIsc) at each mutated exonic position for each of the HMs. Mutations distal to position 15 (beyond a 6-nt overlap of the 6-mer substitution region of 5 to 10) show parallel behavior across these HMs despite the fact that PSI values of WT HMs range from 0.025 to 0.75. HMA behaves exceptionally at positions 16 to 22, due to a secondary structure effect (vide infra). The heat map at the top shows the average R2 values of LEIsc for all pairwise combinations of all HMs (except HMA and HMD), using the 12 mutations at each position.


