
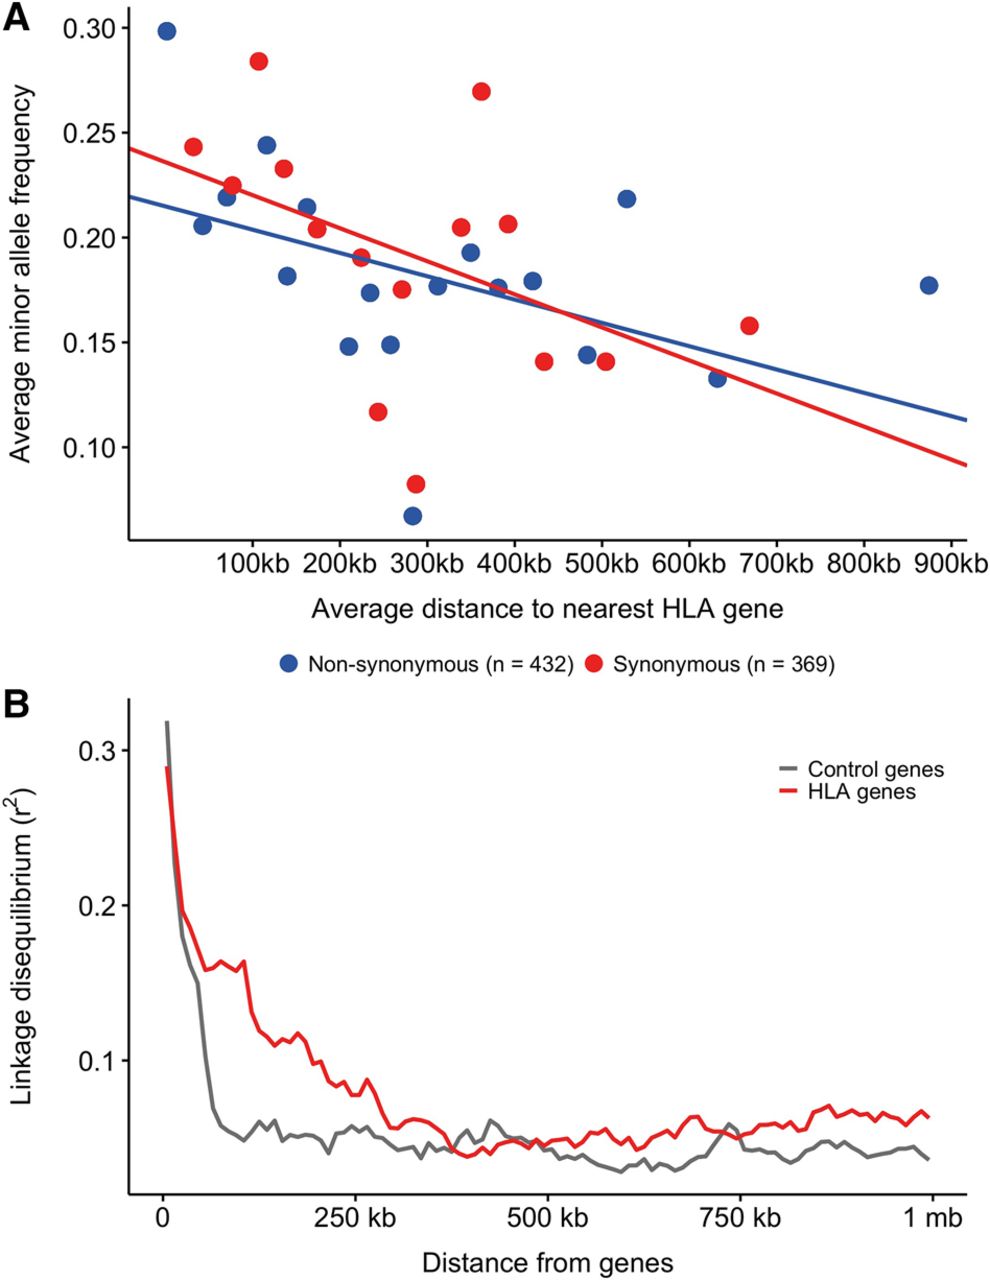
Linked selection. (A) Average minor allele frequencies of nonsynonymous (blue, n = 432, P-value <0.01) and synonymous variants (red, n = 369, P-value <0.001) were calculated in bins of 25 variant sites and plotted as a function of the average distance of those 25 variants to the nearest classical HLA gene (HLA-A, HLA-C, HLA-B, HLA-DRA, HLA-DRB1, HLA-DQA1, HLA-DQB1, HLA-DPA1, HLA-DPB1). Variants within the classical MHC genes are not included. A linear regression was fitted for each variant type on the nonbinned data. (B) Linkage disequilibrium (r2) calculated for all pairs of SNPs in either classical HLA genes (red) or control genes (gray) and all other SNPs in the MHC region are shown here as a function of distance from the genes.


