
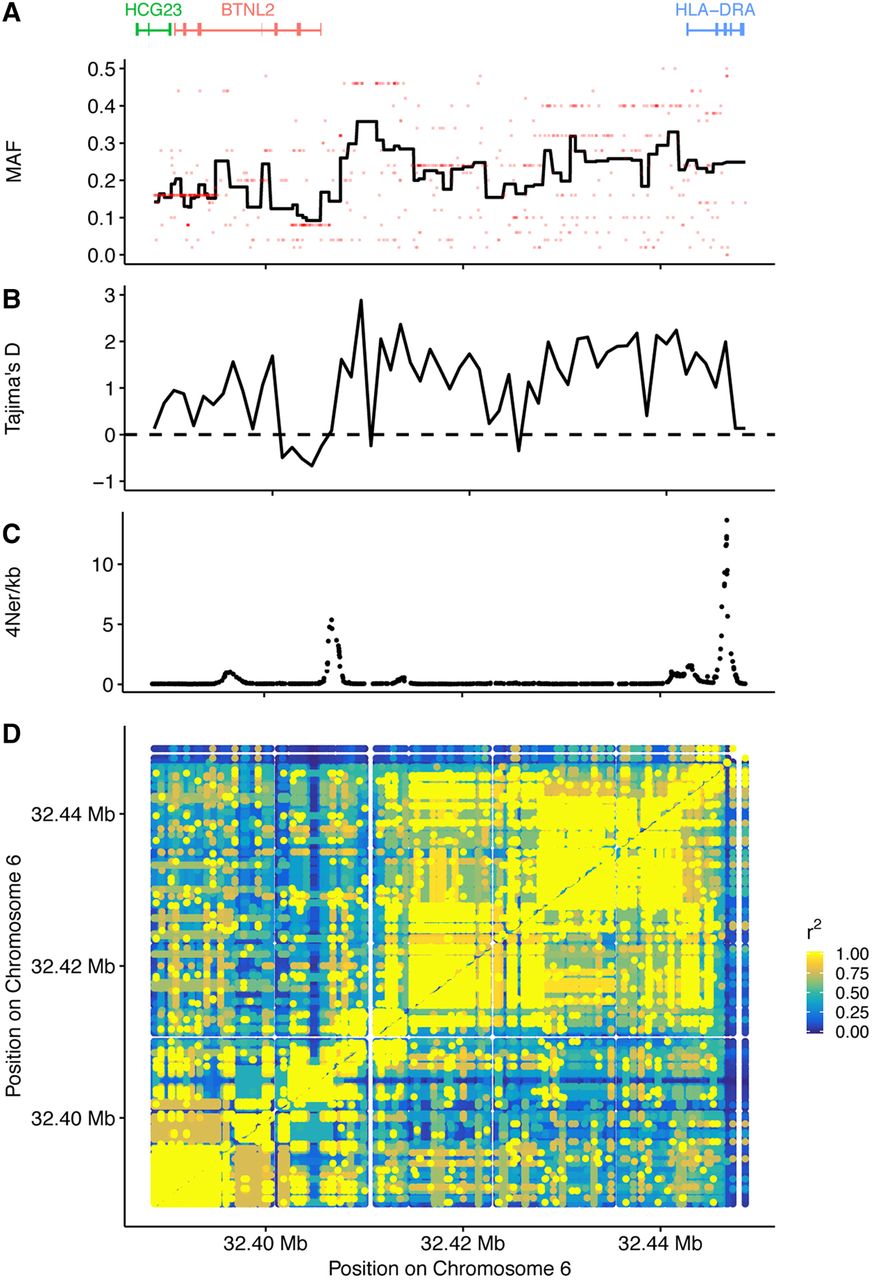
Figure 5.
LD patterns and selection upstream of HLA-DRA. (A) Average minor allele frequencies (MAF) across the region. The red dots are the MAF of the variants, and the line shows the average MAF in bins of 10 variants. (B) Tajima's D statistic calculated in 1-kb bins. (C) Recombination rate estimate. (D) In a 60-kb region upstream of the HLA-DRA gene, the r2 statistics was calculated.


