
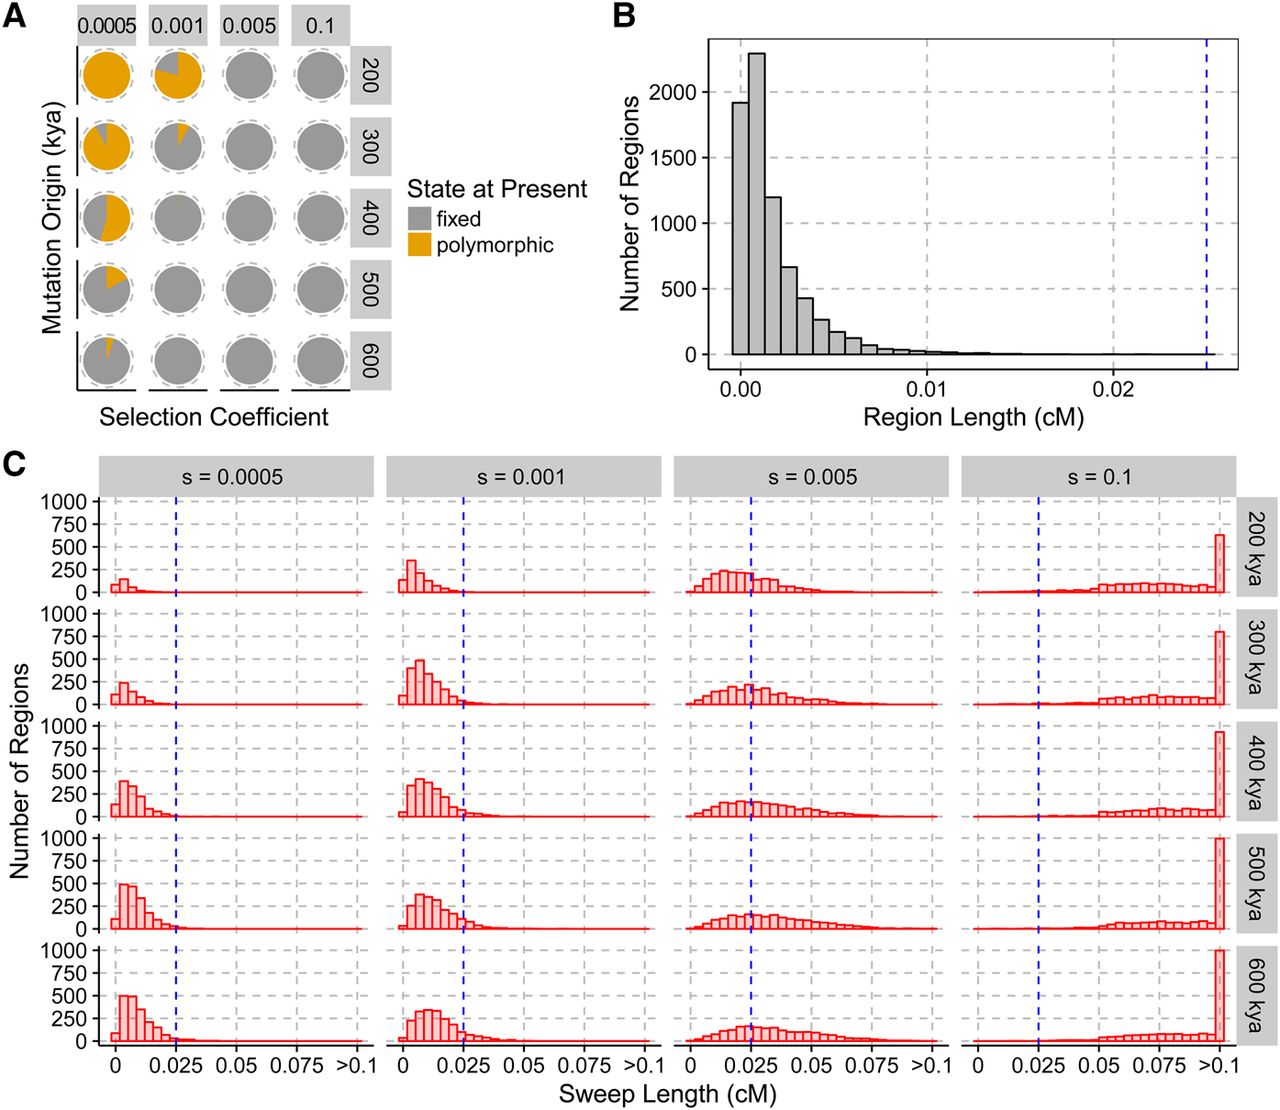
Figure 2.
(A) Fraction of selected alleles reaching fixation (gray) or segregating (orange) at present, depending on the strength of selection (columns) and the age of the mutation (rows, in kya) in our simulations. Events for which the selected variant was lost are not shown. (B) Distribution of the genetic length of external regions simulated under neutrality. (C) Distributions of the genetic length of external regions depending on the strength of selection (columns) and age of mutations in kya (rows). The blue line corresponds to the upper limit for the length of external regions produced under neutrality from B.


