
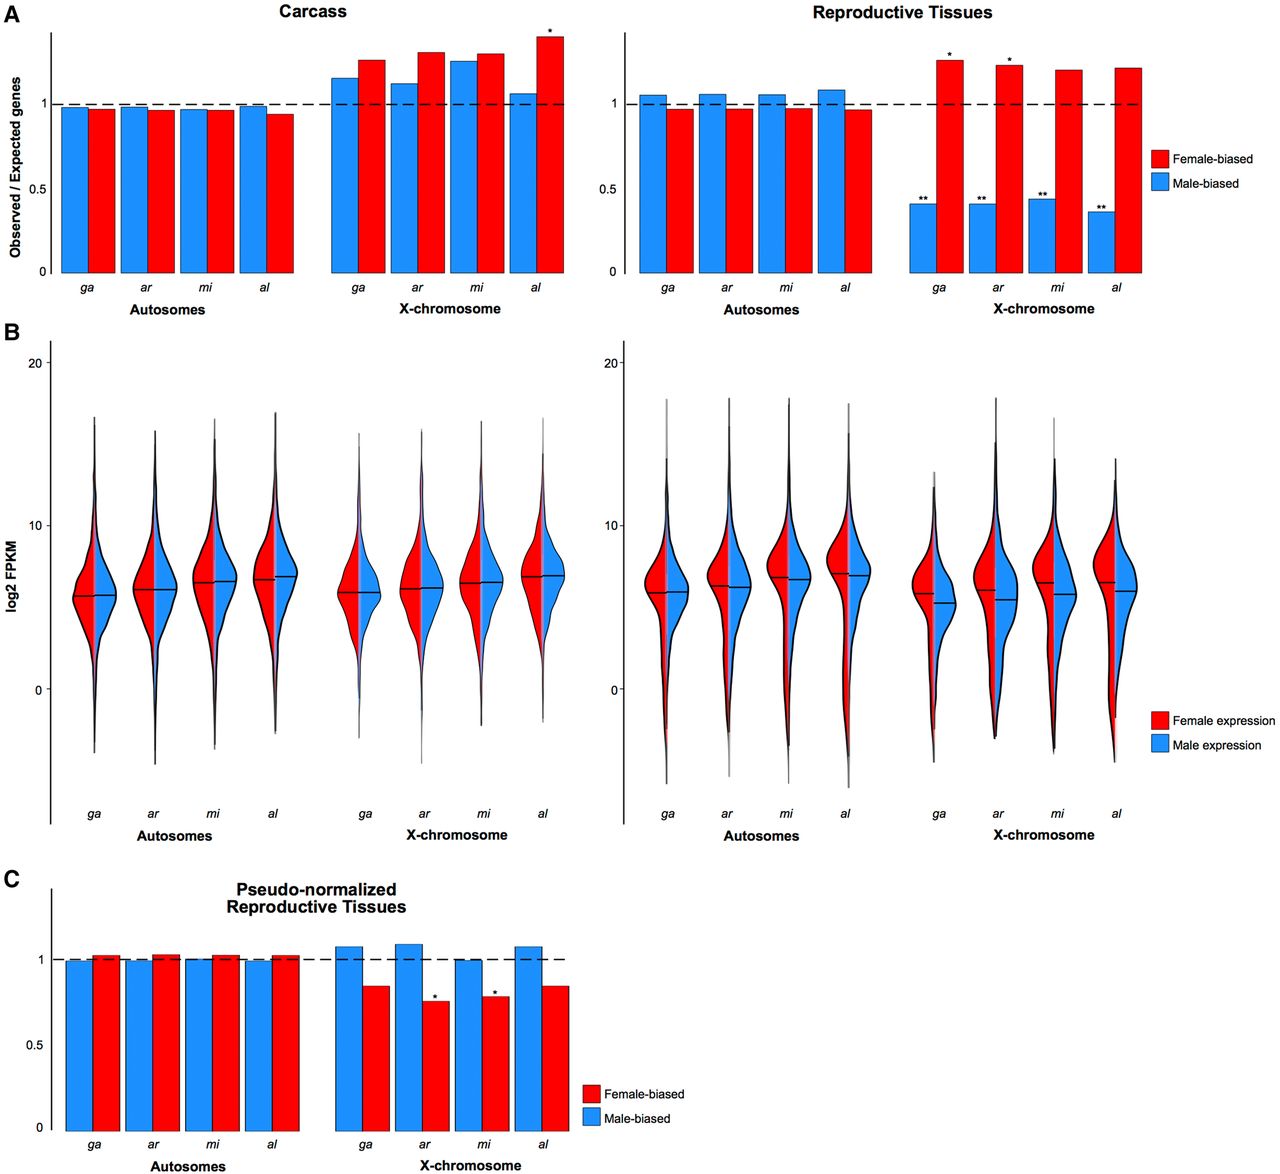
Chromosomal distribution of sex-biased genes. (A) Proportions of observed/expected numbers of male-biased (blue) and female-biased (red) genes in the carcass and reproductive tissues located on autosomes or the X Chromosomes of each species. The horizontal dashed line indicates an equal number of observed and expected genes, and ratios greater or lower than this indicate an enrichment or depletion, respectively. Asterisks indicate: (*) P-value < 0.05, (**) P-value < 0.001, χ2 test comparing ratios between the X Chromosome and the autosomes. (B) Violin plots of expression levels (in log2FPKM) of all genes in the female (red) or male (blue) carcass and reproductive tissues for autosomes and X Chromosomes. (C) Pseudonormalization of X Chromosome male expression in the reproductive tissues using the A:X ratio eliminates the de-masculinization effect.


