
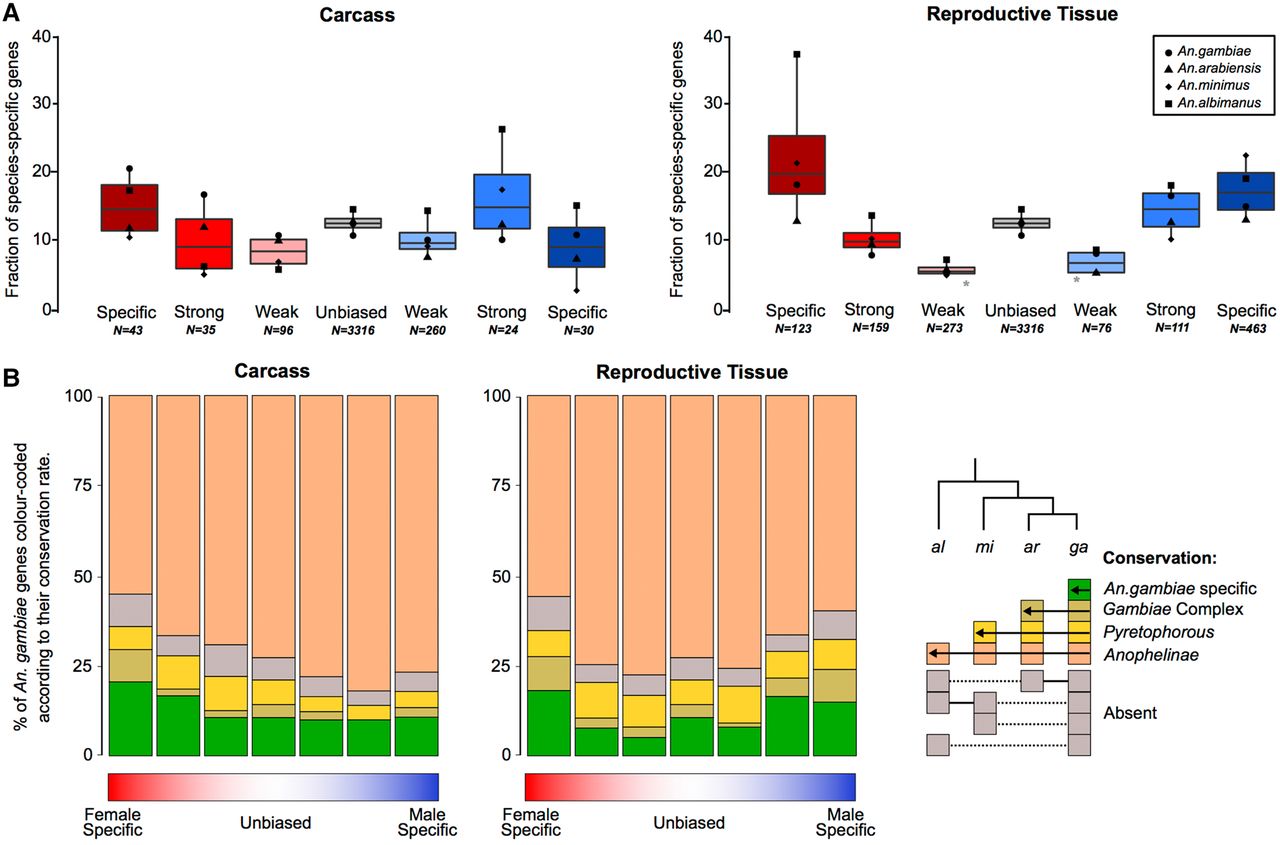
Figure 4.
Sex-biased gene turnover rates. (A) The fraction of species-specific (orphan) genes is plotted for each sex-biased classification for the carcass and reproductive tissues, either for each species individually (points) or all species (box plot). A Wilcoxon rank-sum test of significance was used comparing sex-biased gene expression to unbiased genes; (*) P-value < 0.05. (B) Conservation of An. gambiae sex-biased genes across the phylogeny.


