
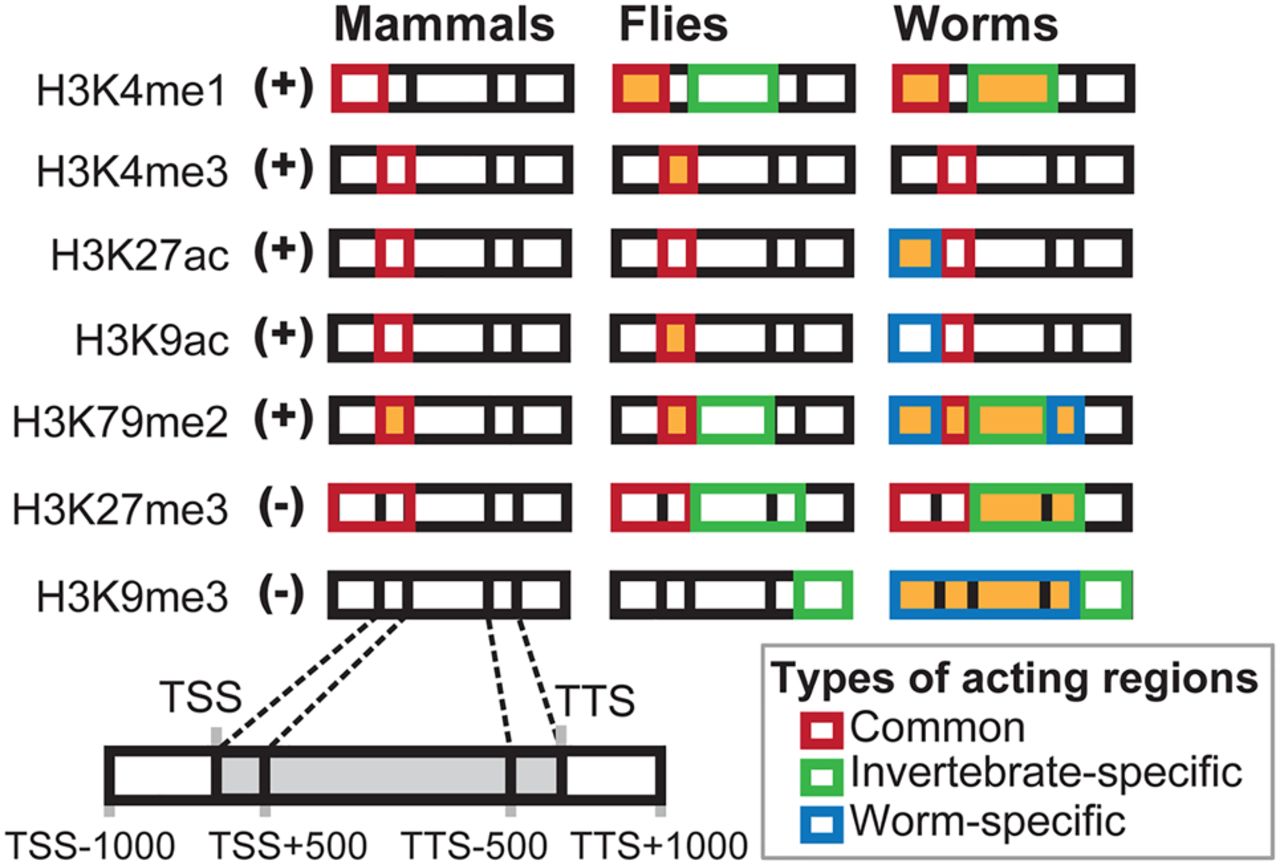
Figure 4.
An overview of the histone marks (+: active; −: repressive) and the corresponding acting regions (shown in orange) that are involved in dosage maintenance in mammals, flies, and worms after gene duplication events. The boxes for each mark in each animal model are intended to represent five consecutive genic regions as diagrammed at the bottom left of the figure.


