
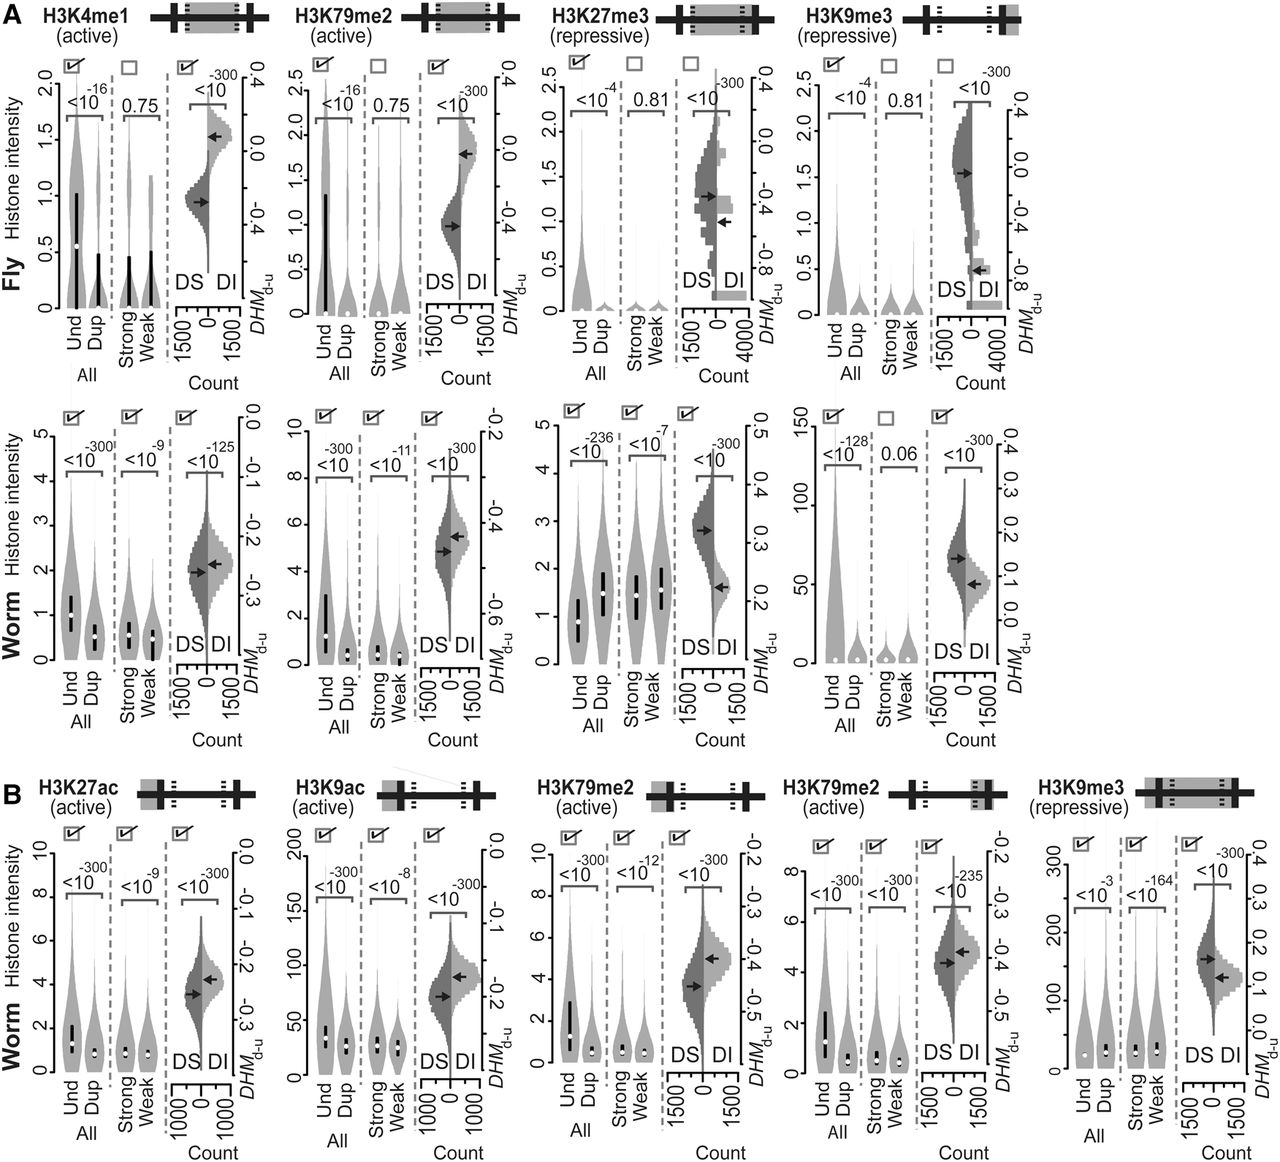
Figure 3.
Intensities of the various active or repressive histone marks that are indicated in the invertebrate-specific (A) and worm-specific (B) acting regions of fly (A) and worm (A,B) genes. Both active and repressive histone marks were compared according to Predicted Patterns I–III. For a detailed description of the figure, see the legend of Figure 2.


