
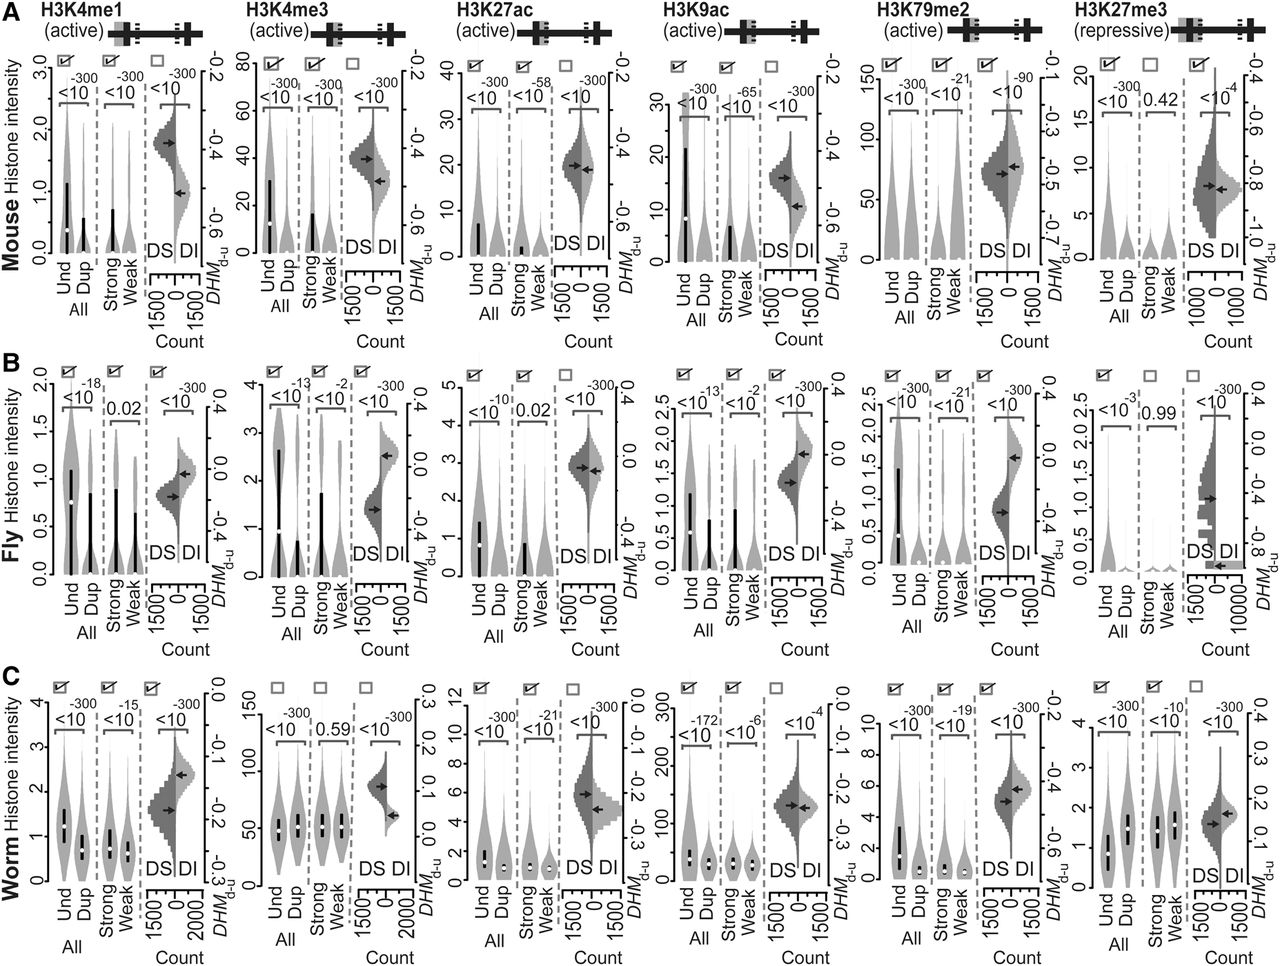
Intensities of the various active or repressive histone marks indicated on common acting regions of mouse (A), fly (B), and worm (C) genes. Both active and repressive histone marks were compared according to Predicted Patterns I–III. At the top of each panel, the solid horizontal line is separated into five segments by four lines to represent the regions of “TSS−1000 to TSS,” “TSS to TSS+500,” “TSS+500 to TTS−500,” “TTS−500 to TTS,” and “TTS to TTS+1000,” from left to right, respectively. The gray shaded area represents the acting regions examined, and the solid versus hatched vertical lines represent boundaries of a gene and boundaries within a gene, respectively. The values of the histone modification intensities are presented as violin plots. If the three boxes at the top of each compared distribution are checked, they indicate that the observed patterns of histone marks are consistent with Predicted Patterns I, II, and III, respectively. P-values were determined with the Mann-Whitney U test and are associated with the horizontal square brackets at the top of each panel that indicate the values that were compared. (Und) unduplicated; (Dup) duplicated; (Strong) strongly expressed; (Weak) weakly expressed; (DS) ortholog sets containing dosage-sensitive genes; (DI) ortholog sets containing only dosage-insensitive genes; (DHMd-u) difference in histone modification (duplicated vs. unduplicated genes), distribution based on 10,000 resampled experiments.


